
Chart Pattern Recognition
Chart patterns are geometric shapes formed by price that can predict future price movement.
Continuation Patterns
Patterns that signal trend will likely continue:
Flags and Pennants
- Form after strong move (flagpole)
- Small consolidation pattern
- Break in direction of prior trend
- Target: measured move equal to flagpole
Triangles
Ascending Triangle:- Flat resistance, rising support
- Usually breaks up
- Flat support, declining resistance
- Usually breaks down
- Converging trendlines
- Breaks in trend direction
Reversal Patterns
Head and Shoulders

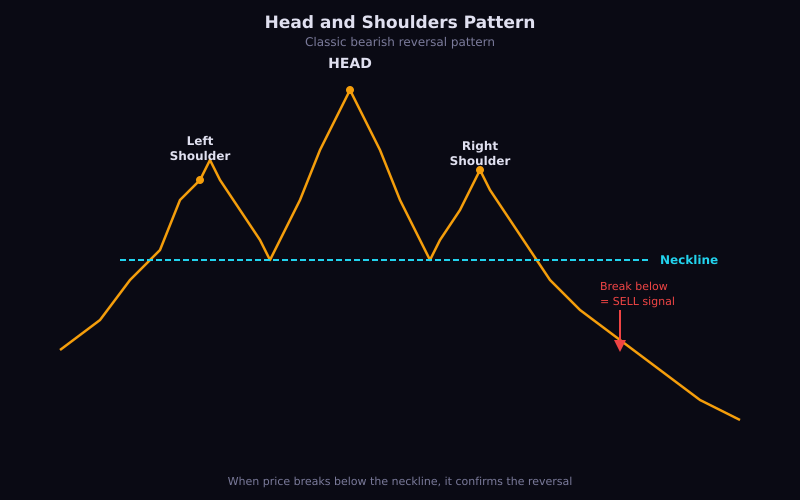
- Three peaks, middle highest (head)
- Neckline connects the lows
- Break below neckline = bearish
- Target: height of head to neckline
Inverse Head and Shoulders
- Three troughs, middle lowest
- Break above neckline = bullish
Double Top/Bottom

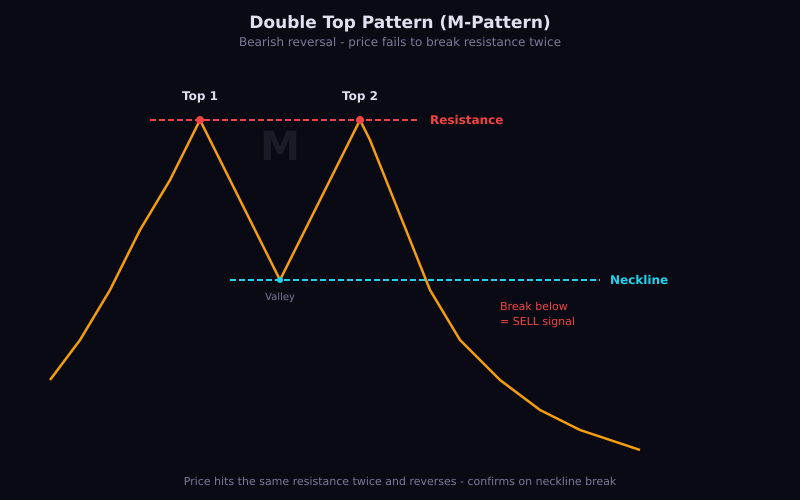
Double Top (M shape):- Two peaks at similar level
- Break below neckline = bearish
- Two troughs at similar level
- Break above neckline = bullish
Pattern Trading Rules
- Wait for confirmation - pattern must complete
- Volume matters - breakout should have increased volume
- Measure targets - use pattern height for profit targets
- Use stop-losses - place beyond pattern boundary
- Time and price - patterns take time to form
Lesson Discussion