
Ascending and Descending Wedge Patterns
Wedge patterns are powerful reversal and continuation signals formed by converging trendlines. Understanding their structure gives you precise entry and exit points.
What is a Wedge Pattern?
A wedge forms when price moves between two converging trendlines that both slope in the same direction. Unlike triangles where lines converge horizontally, wedge lines both tilt up or down.
Rising (Ascending) Wedge
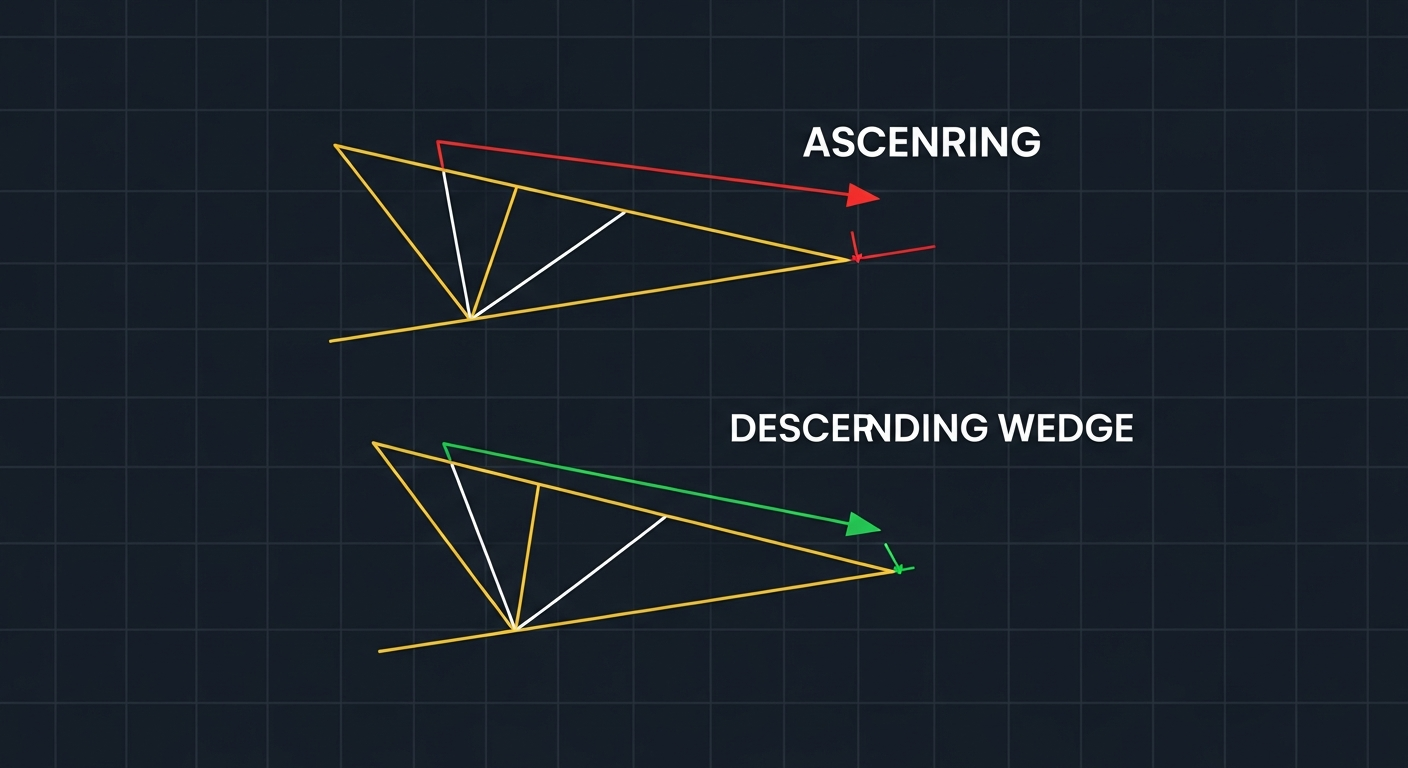
Structure
- Both trendlines slope upward
- Upper trendline (resistance) is flatter
- Lower trendline (support) is steeper
- Price makes higher highs and higher lows, but the range contracts
- Volume typically decreases during formation
Bearish Signal
- Despite price moving up, momentum is weakening
- Buyers are losing strength (narrowing range)
- Usually breaks down through the lower trendline
- Can appear after an uptrend (reversal) or during a downtrend (continuation)
Trading the Rising Wedge
- Identify converging upward-sloping trendlines with at least 3 touches each
- Wait for a decisive break below the lower trendline
- Enter short on the breakout candle close
- Stop loss above the most recent swing high inside the wedge
- Target: Measure the height of the widest part of the wedge and project downward from the breakout point
Confirmation Signals
- Volume spike on the breakdown
- RSI showing bearish divergence before the break
- Break below a key moving average
Falling (Descending) Wedge
Structure
- Both trendlines slope downward
- Lower trendline (support) is flatter
- Upper trendline (resistance) is steeper
- Price makes lower lows and lower highs, but the range contracts
Bullish Signal
- Despite price moving down, selling pressure is weakening
- Bears are losing momentum
- Usually breaks up through the upper trendline
- Can appear after a downtrend (reversal) or during an uptrend (continuation)
Trading the Falling Wedge
- Identify converging downward-sloping trendlines
- Wait for a decisive break above the upper trendline
- Enter long on the breakout candle close
- Stop loss below the most recent swing low inside the wedge
- Target: Height of the widest part projected upward
Wedge vs Triangle
Key Differences
- Wedge: Both lines slope in same direction
- Triangle: Lines converge but in different directions
- Wedge implies momentum exhaustion
- Triangle implies consolidation with no directional bias yet
False Breakouts
How to Avoid
- Wait for a full candle close outside the wedge
- Confirm with volume increase
- Look for a retest of the broken trendline
- Use RSI or MACD confirmation
Timeframe Considerations
- Weekly wedges produce the strongest signals
- Daily wedges are the most commonly traded
- 4-hour wedges work well for intraday swing entries
- Avoid 15-minute wedges unless confirmed by a higher timeframe setup
Key Takeaways
- Rising wedges are bearish, falling wedges are bullish
- Both trendlines slope in the same direction
- Volume typically decreases during formation
- Breakouts should be confirmed with volume
- Measure the widest part for your profit target
Lesson Discussion