
Candlestick Patterns
Candlestick patterns provide insight into market sentiment and potential reversals.
Reversal Patterns
Bullish Reversal
Hammer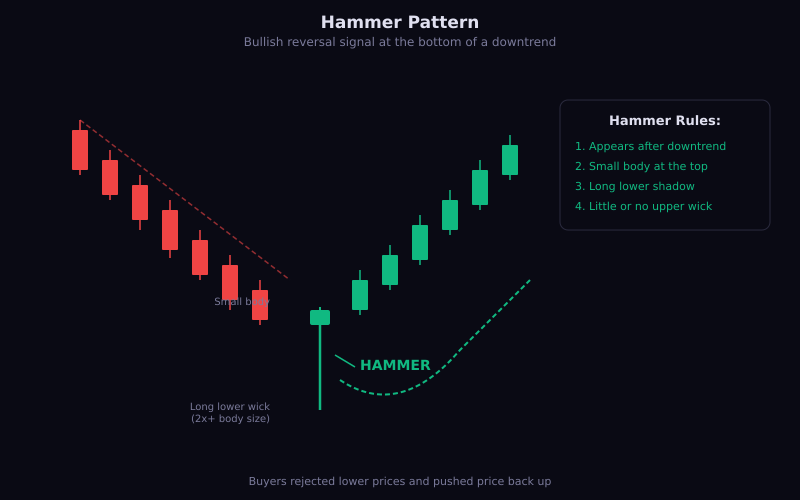

- Small body at top
- Long lower wick
- Appears after downtrend
- Green candle completely engulfs previous red
- Strong buying pressure
- Three candle pattern
- Red, small-bodied, green
- Strong reversal signal
Bearish Reversal
Shooting Star- Small body at bottom
- Long upper wick
- Appears after uptrend
- Red candle engulfs previous green
- Strong selling pressure
- Green, small-bodied, red
- Strong reversal signal
Continuation Patterns
Doji
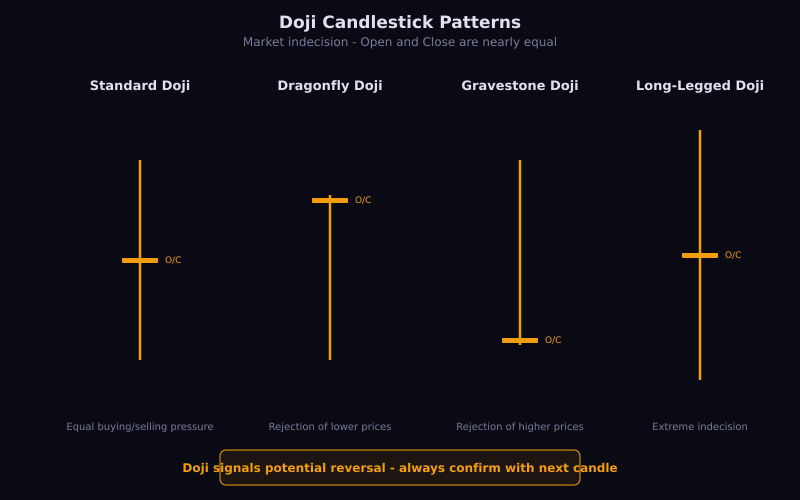
- Open and close nearly equal
- Indicates indecision
- Needs context for direction
- Candle within previous candle's range
- Consolidation before breakout
Trading Tips
- Patterns are more reliable at key levels
- Higher timeframe patterns are stronger
- Always wait for confirmation
- Use with support/resistance
- Don't trade patterns in isolation
Lesson Discussion