
Introduction to Charts
Charts are your window into price action. Understanding them is essential for any trader.
Chart Types
Line Charts
- Simplest form
- Shows closing prices connected
- Good for identifying trends
Bar Charts (OHLC)
- Open, High, Low, Close
- More detail than line charts
- Shows price range for each period
Candlestick Charts

- Most popular among traders
- Visual representation of price movement
- Easy to identify patterns
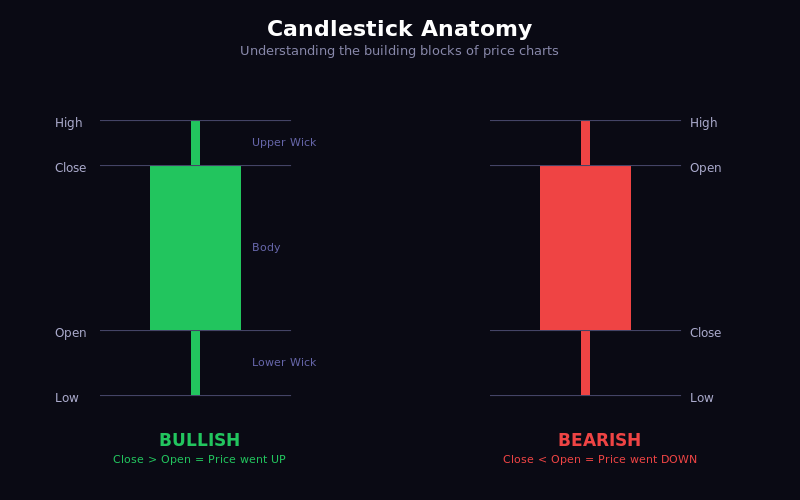
Candlestick Anatomy
- Body: Distance between open and close
- Wick/Shadow: High and low of the period
- Green/White: Close > Open (bullish)
- Red/Black: Close < Open (bearish)
Timeframes
- M1, M5, M15: Scalping
- H1, H4: Day trading
- D1: Swing trading
- W1, MN: Position trading
Reading Price Action
- Identify the trend direction
- Look for support and resistance
- Notice candlestick patterns
- Check volume if available
- Use multiple timeframes for confirmation
Lesson Discussion