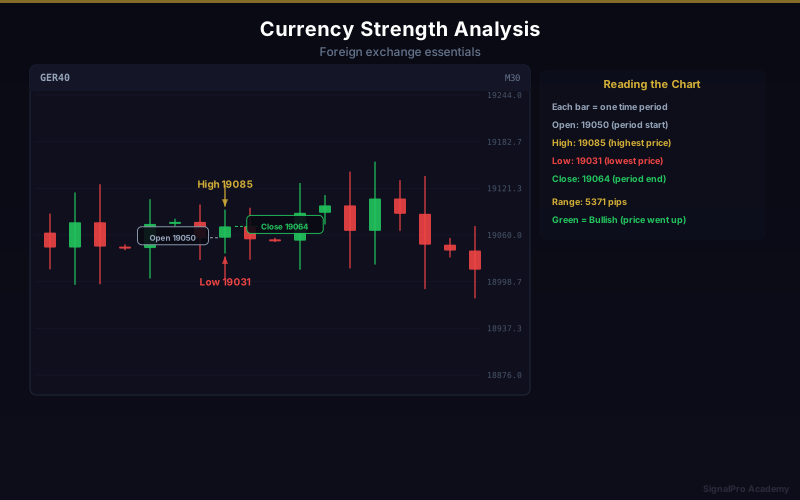
Currency Strength Analysis
Currency strength analysis compares how individual currencies are performing, helping you identify the best pairs to trade by matching the strongest against the weakest.
The Concept
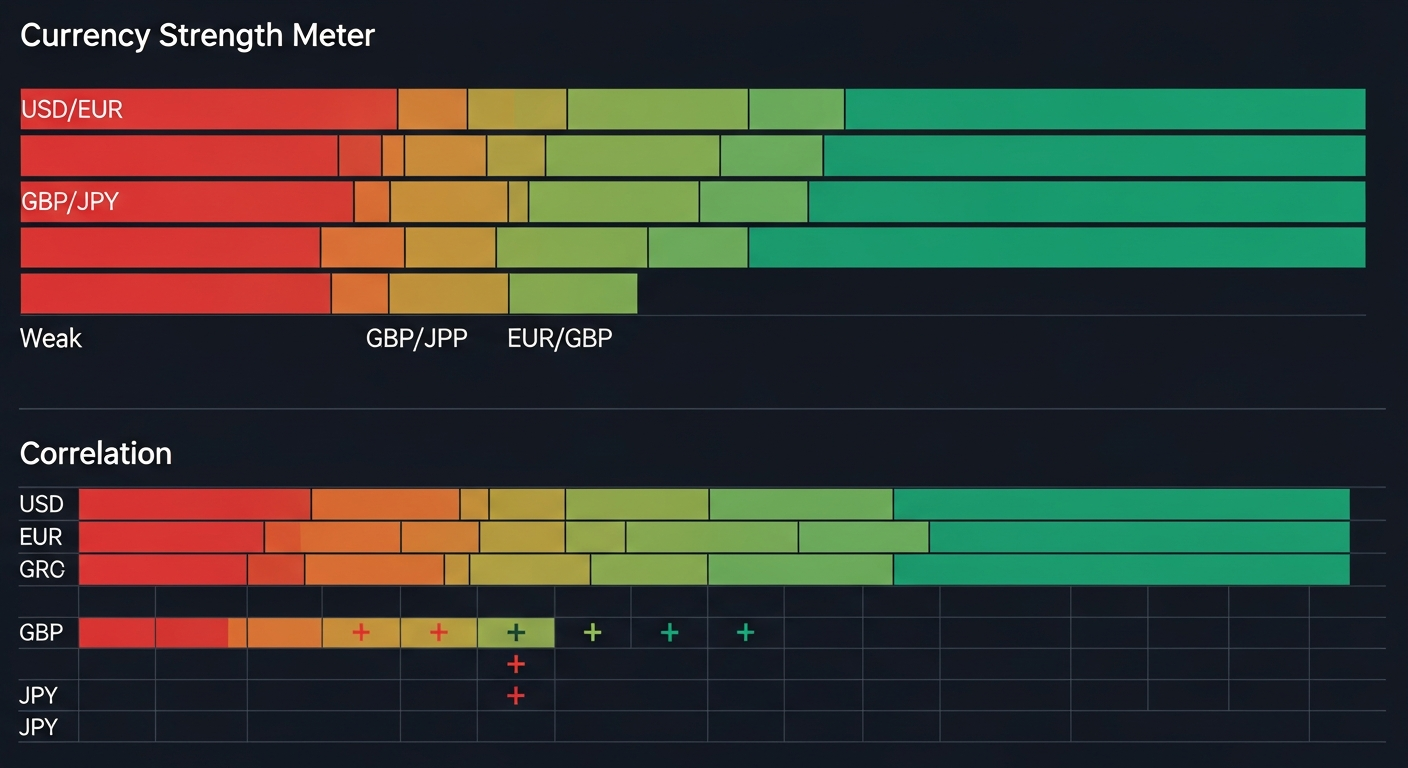
Why Currency Strength Matters
- EUR/USD moves because EUR strengthens OR USD weakens
- Knowing WHICH currency is driving the move is critical
- Strongest vs weakest pairs have clearest trends
- Avoids trading pairs where both currencies are doing the same thing
The 8 Major Currencies
- USD (US Dollar) - World reserve currency
- EUR (Euro) - Second most traded
- GBP (British Pound) - High volatility
- JPY (Japanese Yen) - Safe haven
- AUD (Australian Dollar) - Commodity linked
- NZD (New Zealand Dollar) - Commodity linked
- CAD (Canadian Dollar) - Oil correlated
- CHF (Swiss Franc) - Safe haven
Measuring Currency Strength
Simple Method
- Look at all pairs containing one currency
- Count how many are rising vs falling
- Currency appearing in most rising pairs = strong
- Currency appearing in most falling pairs = weak
Percentage Change Method
- Calculate daily percentage change for each pair
- Average the changes for each currency
- Rank from strongest to weakest
- Update throughout the trading day
RSI-Based Method
- Calculate RSI on all 28 major pairs
- Average RSI for each currency
- High average RSI = overbought/strong
- Low average RSI = oversold/weak
Trading with Currency Strength
The Core Strategy
- Identify the strongest currency today
- Identify the weakest currency today
- Trade the pair combining both
- Go long the strong, short the weak
- This pair will have the clearest trend
Example
- GBP is strongest today (rising against everything)
- JPY is weakest today (falling against everything)
- Trade: BUY GBP/JPY
- This pair will likely have the strongest move
Avoiding Bad Trades
- Both currencies strong: Choppy, no clear direction
- Both currencies weak: Same problem
- Only trade when clear strength differential exists
Advanced Applications
Divergence Detection
- USD strong against EUR but weak against JPY
- This creates cross-pair opportunities
- EUR/JPY could be the better trade
- Always check the cross pairs
Strength Momentum
- Track strength changes over multiple sessions
- Currency getting stronger each day = building momentum
- Currency reversing from extreme = potential turn
- Momentum shifts often lead trend changes by days
Correlation with Fundamentals
- Strong currency usually has hawkish central bank
- Rising interest rate expectations strengthen currencies
- Risk-on favors AUD, NZD; Risk-off favors JPY, CHF
- News events can shift strength instantly
Building Your Strength Dashboard
Daily Routine
- Check currency strength at London open
- Identify top 2 strongest and weakest
- List the pairs they create
- Wait for technical entry on those pairs
- Update strength assessment mid-session
Weekly Analysis
- Compare weekly strength to daily
- Best trades: Daily AND weekly strength align
- Counter-trend caution when they disagree
Key Takeaways
- Trade strongest currency against weakest for best trends
- Avoid pairs where both currencies have similar strength
- Currency strength changes throughout the day
- Combine with technical analysis for precise entries
- Fundamental drivers explain WHY strength shifts occur
Lesson Discussion