Keltner Channel Trading
Keltner Channels use ATR-based envelopes around an EMA to create dynamic support and resistance, offering cleaner signals than Bollinger Bands in trending markets.
Understanding Keltner Channels
Components
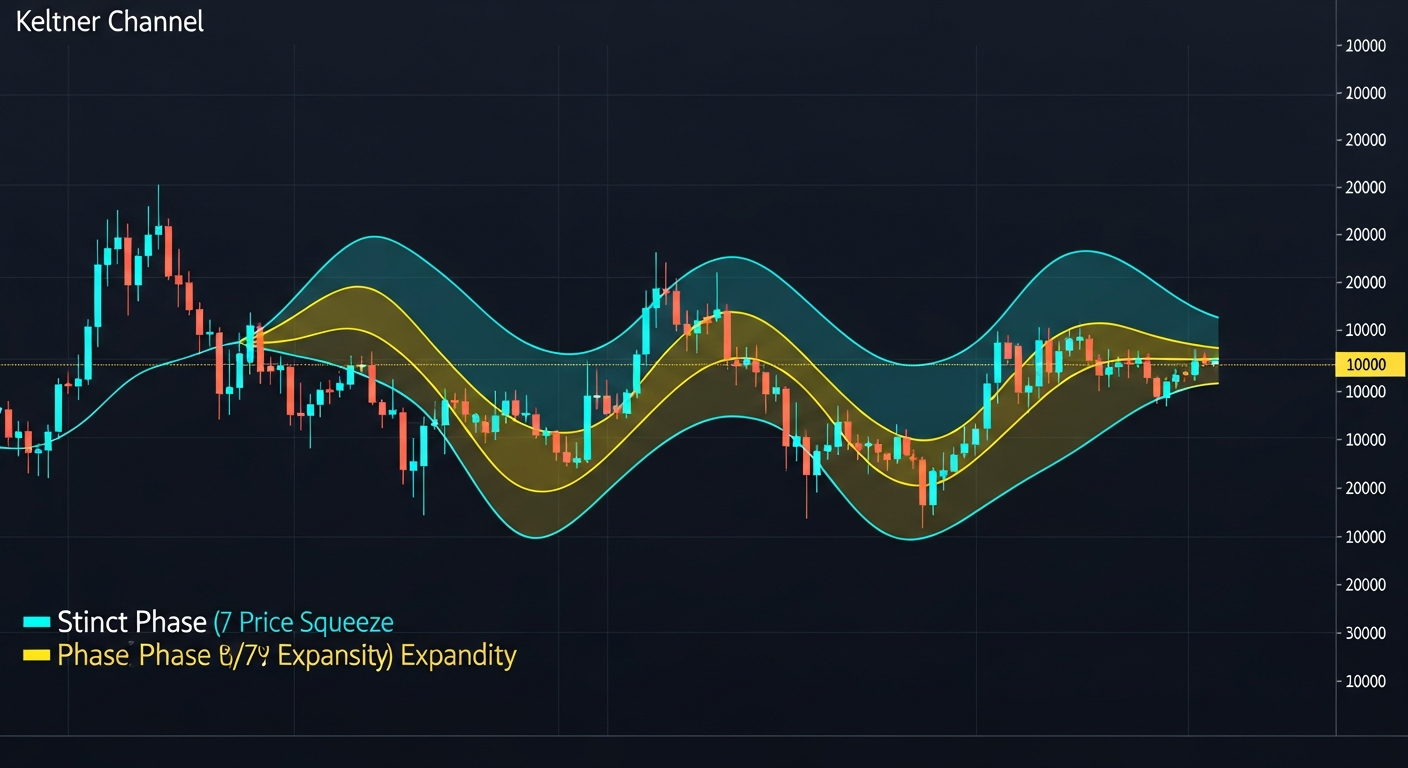
- Middle Line: 20-period EMA (moving average of price)
- Upper Channel: EMA + (2 x ATR)
- Lower Channel: EMA - (2 x ATR)
- Width expands in volatile markets, contracts in quiet ones
vs Bollinger Bands
- Bollinger uses standard deviation (reacts to price spikes)
- Keltner uses ATR (smoother, less reactive to single candles)
- Keltner channels are smoother and less jagged
- Better for trend following, Bollinger better for mean reversion
Trading Strategies
Channel Breakout Strategy
- Wait for candle to close above upper channel
- This signals strong upward momentum
- Enter long on close above upper channel
- Stop loss at the middle line (EMA)
- Target 1.5-2x the channel width
Channel Bounce Strategy
- In uptrend: Price pulls back to lower channel
- Wait for bullish candle at lower channel
- Enter long with stop below lower channel
- Target the upper channel
- In downtrend: reverse for shorts at upper channel
Squeeze Strategy (Keltner + Bollinger)
- When Bollinger Bands move INSIDE Keltner Channels
- This indicates extreme low volatility (squeeze)
- Energy is building for a big move
- Enter when Bollinger breaks outside Keltner
- Direction of breakout = direction of trade
Advanced Techniques
Double Keltner Setup
- Inner channel: EMA + 1.5 x ATR
- Outer channel: EMA + 2.5 x ATR
- Zone between channels = momentum zone
- Price staying in outer zone = very strong trend
Keltner as Trend Filter
- Price above middle line = bullish bias
- Price below middle line = bearish bias
- Price above upper channel = overextended up
- Price below lower channel = overextended down
Multi-Timeframe Keltner
- Higher timeframe: Determine trend direction
- Lower timeframe: Find entries at channel edges
- Trade bounces in direction of higher TF trend
Settings Optimization
Standard Settings
- EMA Period: 20
- ATR Multiplier: 2.0
- ATR Period: 10
Day Trading
- EMA Period: 10-15
- ATR Multiplier: 1.5
- More responsive, tighter channels
Swing Trading
- EMA Period: 20-30
- ATR Multiplier: 2.0-2.5
- Smoother, fewer false signals
Risk Management
Stop Loss Placement
- Channel bounce trades: Below opposite channel edge
- Breakout trades: At middle line (EMA)
- Maximum risk: 1-2% of account per trade
Position Sizing
- Measure channel width for volatility assessment
- Wider channels = smaller position size
- Narrower channels = can use larger size
Key Takeaways
- Keltner uses ATR for smoother channels than Bollinger
- Breakouts above/below channels signal momentum
- Bounces off channels provide mean-reversion entries
- Squeeze with Bollinger identifies explosive setups
- Best combined with trend direction filters
Lesson Discussion