
Market Profile and TPO Charts
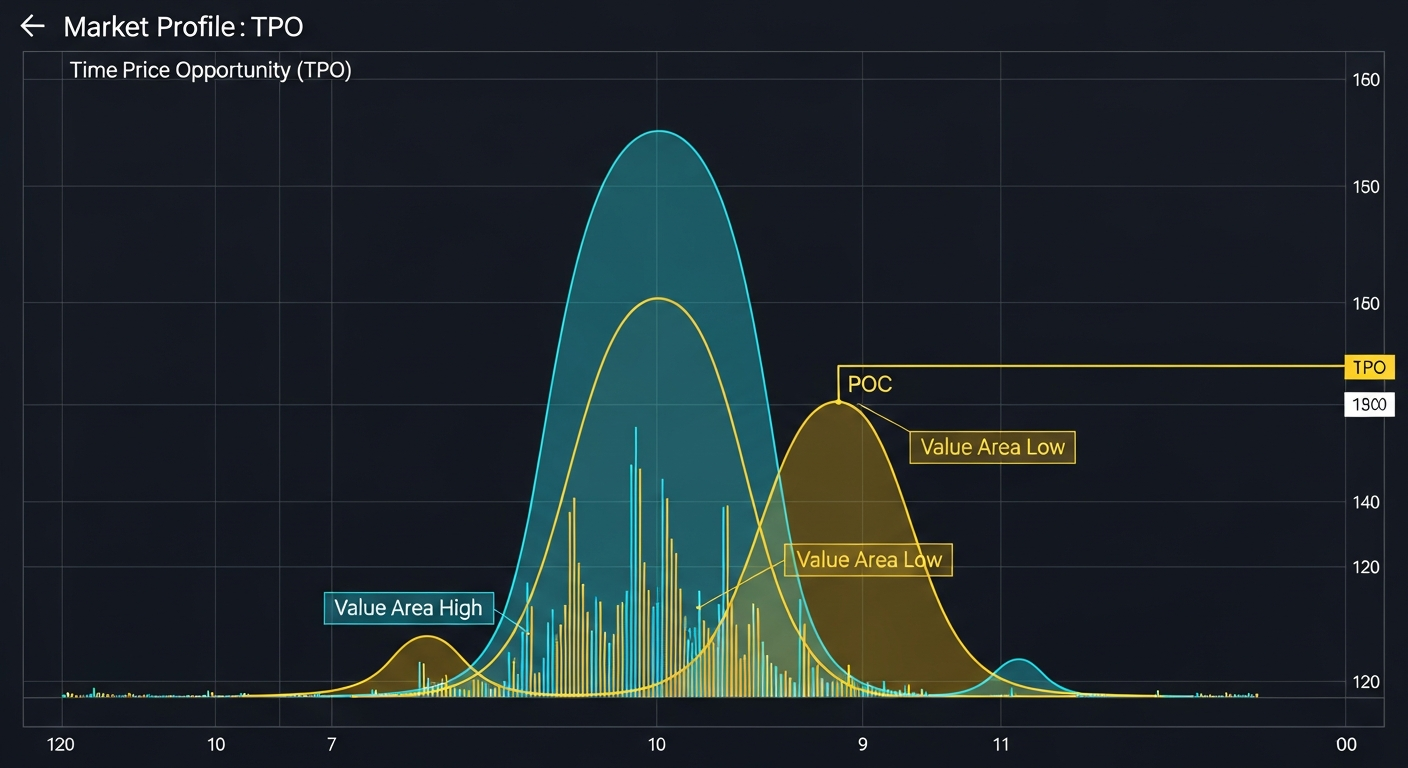
Market Profile uses Time Price Opportunity (TPO) charts to show WHERE price spent the most time, revealing the fair value that institutional traders use for decision-making.
Auction Market Theory
The Core Principle
- Markets exist to facilitate trade between buyers and sellers
- Price moves to find equilibrium (fair value)
- When price is at fair value: High volume, balanced trading
- When price is away from fair value: Low volume, directional moves
Price Discovery
- Markets alternate between balance and imbalance
- Balance: Price rotates in a range (value area)
- Imbalance: Price trends directionally seeking new value
- Understanding which phase you are in is critical
Reading Market Profile
TPO Letters
- Each 30-minute period gets a letter (A, B, C...)
- Letter is placed at each price level traded during that period
- Over the day, letters build up creating a profile shape
- Areas with many letters = price spent a lot of time there
Key Levels
- Point of Control (POC): Price with most TPOs (most time)
- Value Area High (VAH): Upper boundary of value
- Value Area Low (VAL): Lower boundary of value
- Value Area contains 70% of the day trading activity
Profile Shapes
- Normal Distribution (Bell Curve): Balanced day, range-bound
- P-Shape: Buying in upper range, selling below
- b-Shape: Selling in lower range, buying above
- D-Shape: Elongated, strong trend day
- Double Distribution: Two areas of value, gap between them
Trading with Market Profile
Value Area Trading
- Identify previous day Value Area (VAH, POC, VAL)
- If market opens inside value area: Expect rotation
- Buy near VAL, sell near VAH
- Target POC as the magnet price
Breakout from Value
- Price moves above VAH or below VAL
- If price holds above VAH: New value establishing higher
- Enter long on retest of VAH as support
- Target: Previous day high or POC + value area width
POC Migration
- Track where POC moves day to day
- Rising POC = value moving higher (bullish)
- Falling POC = value moving lower (bearish)
- Flat POC = market in balance
Advanced Concepts
Composite Profile
- Build profile over multiple days or weeks
- Shows longer-term value area
- More significant support/resistance levels
- Institutional traders reference these levels
Single Prints
- Areas where only one TPO letter exists
- Indicates rapid price movement through that zone
- Often act as support/resistance on revisits
- Market moved too fast for two-way trading
Excess and Initiative
- Excess: Price spikes that immediately reject (tails)
- Shows strong rejection by one side
- Initiative activity: Moves away from value
- Responsive activity: Moves back toward value
Practical Application
Daily Routine
- Mark previous day VAH, POC, VAL before session
- Note opening location relative to value area
- Monitor profile development during session
- Identify which profile shape is forming
- Trade based on value area dynamics
Combining with Order Flow
- Market Profile shows WHERE price spent time
- Volume Profile shows WHERE most volume occurred
- Delta shows WHO was more aggressive (buyers or sellers)
- Together: Complete picture of market activity
Key Takeaways
- Market Profile reveals fair value through time-at-price
- POC is the most important level (highest activity)
- Value area bounds contain 70% of trading activity
- Profile shapes indicate market type (trend vs range)
- Institutional traders use these levels for decision-making
Lesson Discussion