
How to Read Candlestick Charts
Candlesticks tell a story. Learn to read them.
Anatomy of a Candlestick
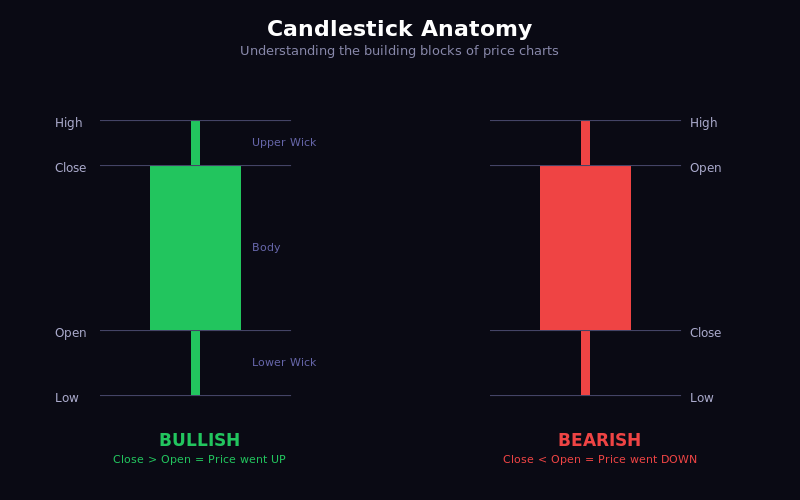

The Body
- Shows open to close range
- Thick body = strong conviction
The Wicks
- Upper wick = high of period
- Lower wick = low of period
- Long wick = rejection
Bullish vs Bearish
Bullish (Green)
- Close HIGHER than open
- Buyers won
Bearish (Red)
- Close LOWER than open
- Sellers won
Key Patterns
Doji
- Open equals close
- Shows indecision
Hammer
- Small body at top
- Long lower wick
- Bullish reversal
Shooting Star
- Small body at bottom
- Long upper wick
- Bearish reversal
Engulfing
- Current candle engulfs previous
- Strong reversal signal
Common Mistakes
- Trading single candles alone
- Ignoring the trend
- Not waiting for confirmation
Lesson Discussion