
Risk of Ruin and Survival Analysis
Risk of ruin calculates the mathematical probability that your trading strategy will eventually blow your account. Understanding this determines whether your strategy is viable long-term.
What is Risk of Ruin?
The Core Question
- Given your win rate, risk-reward, and position size
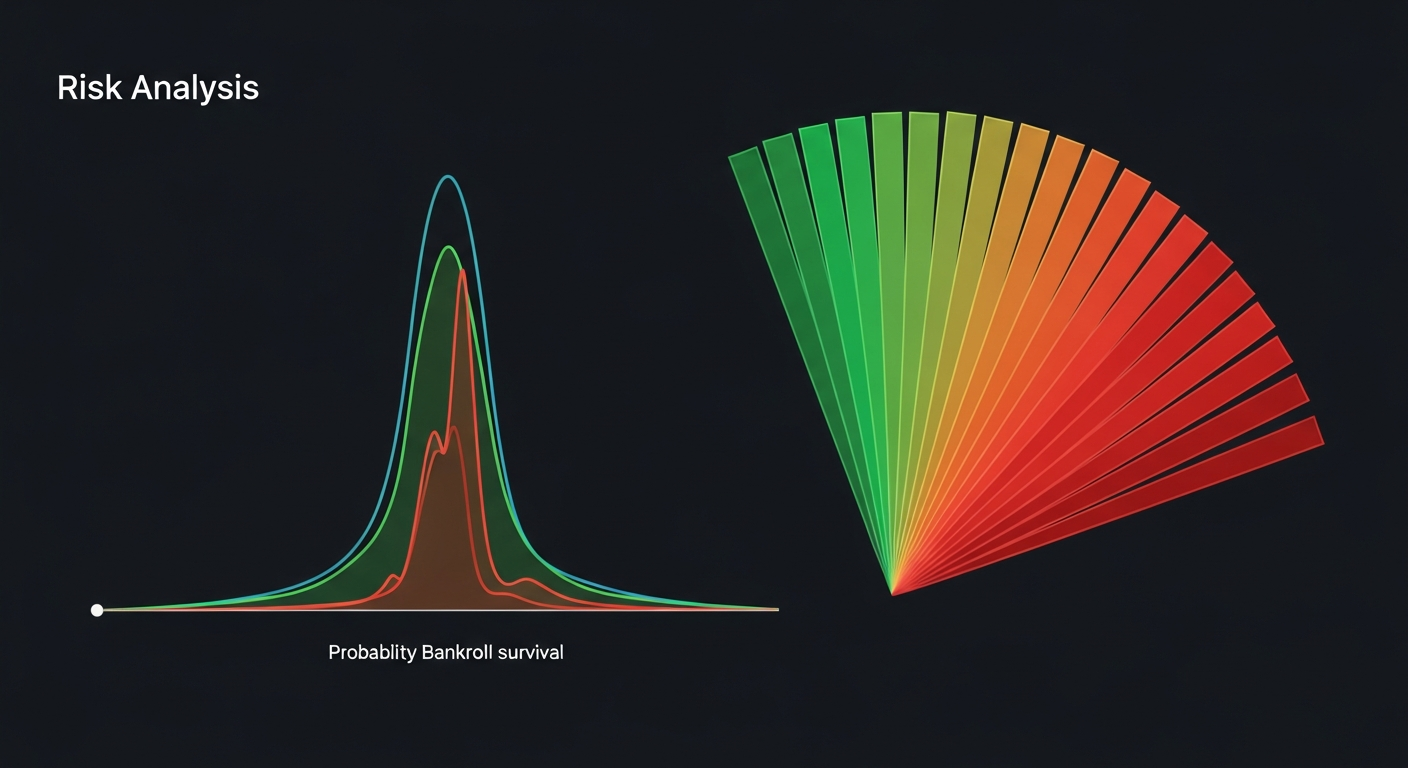
- What is the probability you will lose X% of your account?
- Even profitable strategies can blow accounts if risk is wrong
- This is the most important calculation in trading
Key Variables
- Win Rate: Percentage of winning trades
- Average Win: Average profit on winners
- Average Loss: Average loss on losers
- Risk Per Trade: Percentage of account risked
- Drawdown Threshold: At what loss % do you stop?
Calculating Risk of Ruin
Simple Formula
- If (Win Rate x Avg Win) > ((1 - Win Rate) x Avg Loss)
- Then strategy has positive expectancy
- But positive expectancy alone is NOT enough
- Position size determines if you survive long enough
The Math
- Expectancy = (Win% x Avg Win) - (Loss% x Avg Loss)
- If Expectancy is positive, strategy is profitable OVER TIME
- But variance can destroy you before you reach the long run
- Risk of Ruin formula: ((1-Edge)/(1+Edge))^Units
- Where Edge = (Win% x Payoff) - Loss%
- And Units = Capital / Risk per trade
Practical Examples
Strategy A (Dangerous)
- Win Rate: 55%
- Risk-Reward: 1:1
- Risk Per Trade: 5% of account
- Risk of Ruin (50% drawdown): 23%
- Nearly 1 in 4 chance of losing half your account
Strategy B (Safe)
- Win Rate: 55%
- Risk-Reward: 1:1
- Risk Per Trade: 1% of account
- Risk of Ruin (50% drawdown): 0.03%
- Virtually zero chance of catastrophic loss
The Lesson
- Same strategy, same win rate, same R:R
- Only difference is position size (5% vs 1%)
- Risk of ruin drops from 23% to 0.03%
- Position sizing is everything
Monte Carlo Simulation
What It Does
- Runs your strategy parameters 10,000+ times
- Each run randomizes the order of wins and losses
- Shows the range of possible outcomes
- Reveals worst-case drawdowns you should expect
What You Learn
- Maximum expected drawdown
- How long losing streaks can last
- Probability of reaching your profit targets
- Whether your strategy survives worst-case scenarios
Running Your Own Simulation
- Record your last 100+ trades
- Input win rate, avg win, avg loss
- Set position size
- Run 10,000 simulations
- Look at the worst 5% of outcomes
- Can you survive those outcomes?
Drawdown Recovery
The Asymmetry Problem
- 10% loss needs 11% gain to recover
- 20% loss needs 25% gain to recover
- 30% loss needs 43% gain to recover
- 50% loss needs 100% gain to recover
- 70% loss needs 233% gain to recover
Maximum Acceptable Drawdown
- Professional funds: 15-20% max
- Prop firms: 5-10% daily, 10-12% total
- Personal accounts: Set your own limit (20-30% recommended)
- Beyond your limit: Stop trading, reduce size, reassess
Optimal Position Sizing
Fixed Fractional Method
- Risk the same percentage on every trade
- Typical: 0.5% to 2% of account
- Account grows: Position size grows proportionally
- Account shrinks: Position size shrinks (built-in protection)
Kelly Criterion
- Formula: Kelly % = W - (1-W)/R
- W = Win rate, R = Win/Loss ratio
- Gives the mathematically optimal bet size
- WARNING: Full Kelly is too aggressive for trading
- Use Half Kelly or Quarter Kelly (Kelly / 2 or Kelly / 4)
Anti-Martingale
- Increase size after wins, decrease after losses
- Compound when strategy is working
- Reduce exposure during drawdowns
- Aligns with momentum of your equity curve
Survival Rules
The Non-Negotiables
- Never risk more than 2% per trade
- Never have more than 6% total risk open
- Reduce size by 50% after 10% drawdown
- Stop trading after 15% drawdown (reassess)
- Your number one job is to survive
Key Takeaways
- Risk of ruin must be calculated before risking real money
- Position sizing determines survival more than win rate
- Even profitable strategies fail with wrong position size
- Monte Carlo simulation reveals true risk
- Survival is the prerequisite for profit
Lesson Discussion