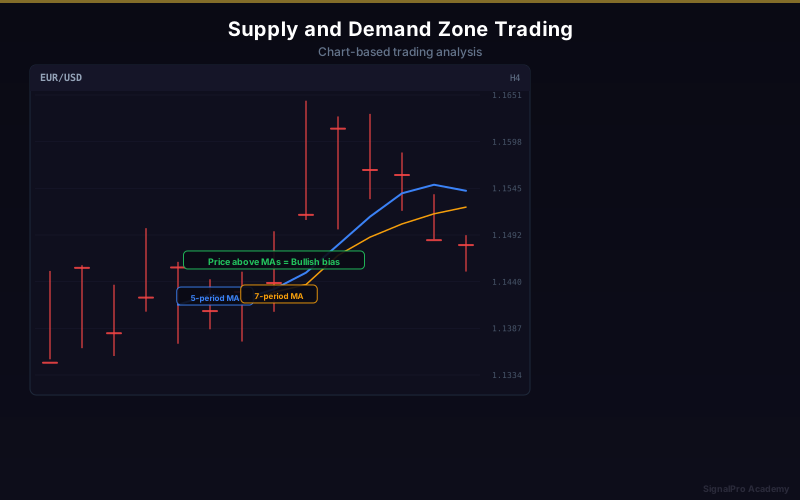
Supply and Demand Zone Trading
Supply and demand zones reveal where institutional orders were placed, providing high-probability trading levels.
What are Supply and Demand Zones?
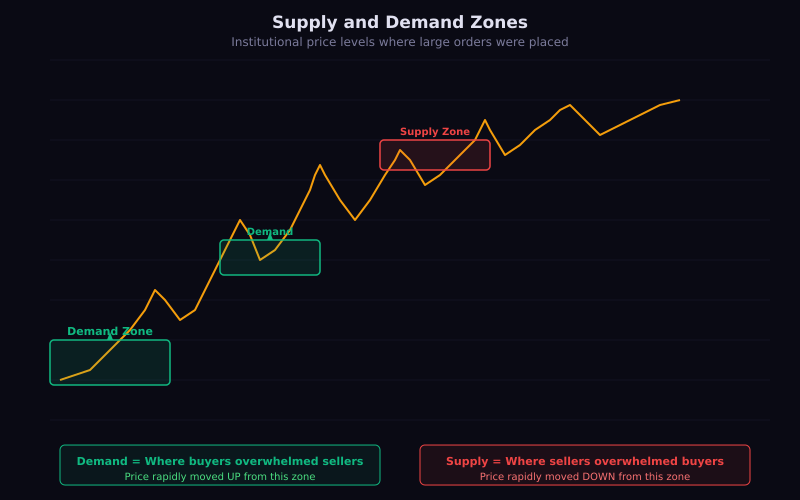
Unlike traditional support and resistance lines, supply and demand zones are price AREAS where significant buying or selling occurred.
Demand Zones (Buying Zones)
Characteristics
- Area where aggressive buying occurred
- Price rallied sharply from this zone
- Institutions placed large buy orders
- Often at the base of strong up moves
How to Identify
- Find a strong bullish move on the chart
- Go to the base of that move
- Mark the last consolidation or opposing candle
- This area is your demand zone
Trading Demand Zones
- Wait for price to return to the zone
- Look for buying signals (bullish candles)
- Enter with stop below the zone
- Target: the previous high or beyond
Supply Zones (Selling Zones)
Characteristics
- Area where aggressive selling occurred
- Price dropped sharply from this zone
- Institutions placed large sell orders
- Often at the top of strong down moves
How to Identify
- Find a strong bearish move on the chart
- Go to the origin of that move
- Mark the last consolidation or opposing candle
- This area is your supply zone
Zone Quality Assessment
Fresh vs Tested Zones
- Fresh: Never been retested (strongest)
- Tested once: Still valid but slightly weaker
- Tested multiple times: Likely to break
Strength Factors
- Speed of departure: Faster = stronger zone
- Distance traveled: Further = more institutional interest
- Time at the zone: Less time = stronger (immediate rejection)
- Number of candles: Fewer candles in zone = cleaner
The "Spring" Factor
- Price barely touches zone before reversing
- Shows extreme buying/selling interest
- These are the highest quality zones
Drawing Zones Correctly
Step-by-Step
- Identify the impulse move (strong directional candles)
- Find the base (last candle before the impulse)
- Draw rectangle from the base candle's high to low
- Extend the rectangle to the right
- This is your supply or demand zone
Common Mistakes
- Drawing zones too wide (include only the base candles)
- Using old, well-tested zones
- Ignoring the overall trend context
- Not confirming with higher timeframe zones
Combining with Other Analysis
- Zone + Trend alignment = highest probability
- Zone + Fibonacci level = confluence
- Zone + Round number = institutional interest
- Zone + Candlestick pattern = entry timing
Key Takeaways
- Zones are areas, not exact prices
- Fresh zones are strongest
- Trade with the trend for best results
- Quality over quantity in zone selection
- Always wait for price to reach the zone
Lesson Discussion