
Wyckoff Accumulation and Distribution Deep Dive
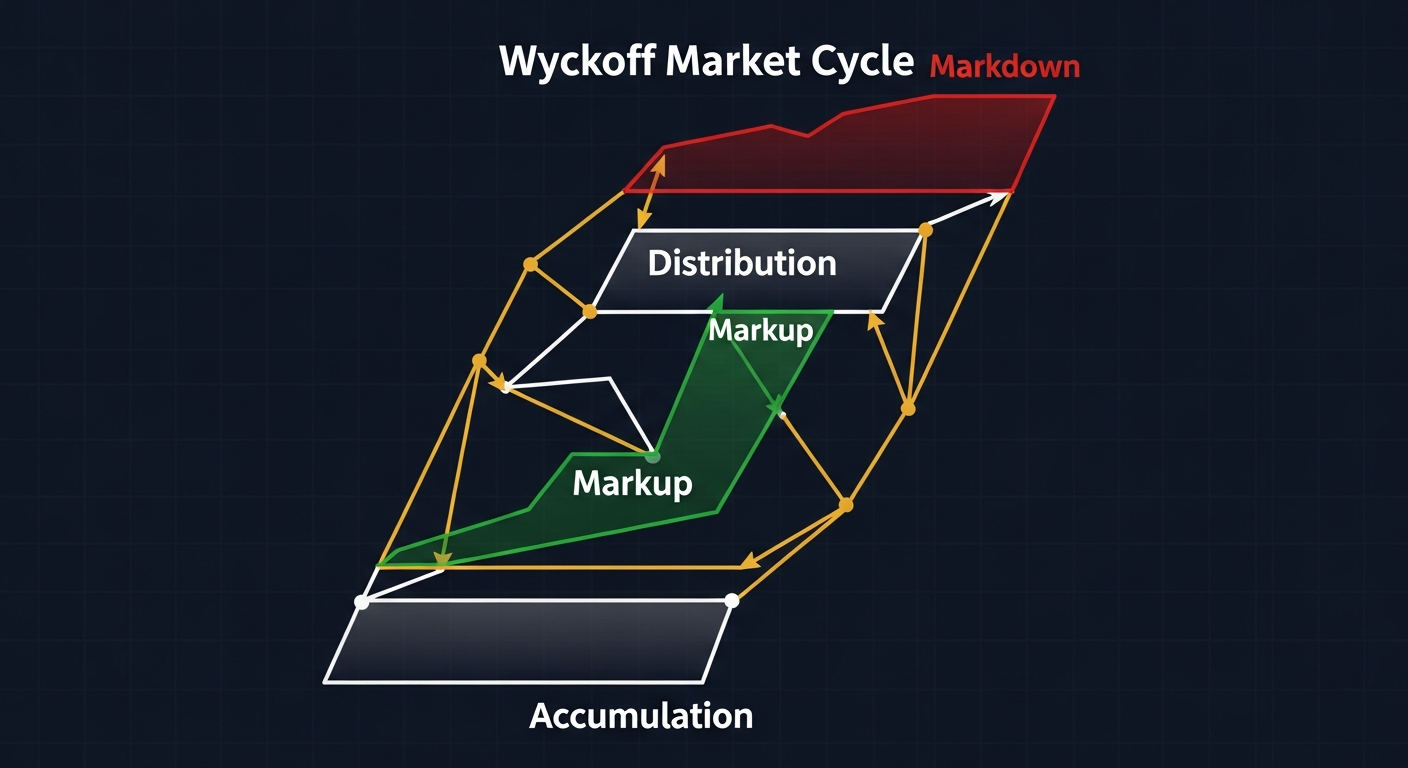
The Wyckoff Method is an institutional trading framework developed by Richard Wyckoff in the early 1900s. It reveals how large operators manipulate price to accumulate and distribute positions.
Wyckoff Accumulation Schematic
Accumulation is the process where institutions build large positions at low prices before a markup phase.
Phase A: Stopping the Downtrend
- PS (Preliminary Support): First significant buying appears, slowing the decline
- SC (Selling Climax): Panic selling with wide spread and heavy volume, institutions absorb supply
- AR (Automatic Rally): Short covering rally after the selling climax, defines the upper boundary
- ST (Secondary Test): Price returns to the SC area on lighter volume, testing if selling is truly exhausted
Phase B: Building the Cause
- Longest phase, can last weeks or months
- Price ranges between the AR high and SC low
- Institutions quietly accumulate positions
- Multiple tests of support and resistance within the range
- Volume analysis shows accumulation (higher volume on up moves)
Phase C: The Spring
- Spring/Shakeout: Price drops below the trading range support briefly
- Designed to trigger stop losses and shake out weak holders
- Institutions buy aggressively at the lowest prices
- Volume may be high but price quickly recovers
- The most important entry signal in the entire schematic
Phase D: Markup Begins
- SOS (Sign of Strength): Strong rally on high volume breaking above the trading range
- LPS (Last Point of Support): Pullback on lighter volume to the former resistance area
- This pullback is your secondary entry opportunity
- Price begins making higher highs and higher lows
Phase E: Full Markup
- Clear uptrend with pullbacks to support
- Increasing public participation
- Volume confirms trend direction
Wyckoff Distribution Schematic
Distribution is the mirror image where institutions sell positions to the public at high prices.
Phase A: Stopping the Uptrend
- PSY (Preliminary Supply): First significant selling appears
- BC (Buying Climax): Euphoric buying with wide spread, institutions distribute
- AR (Automatic Reaction): Sell-off after the buying climax, defines lower boundary
- ST (Secondary Test): Price returns to BC area on lighter volume
Phase B: Building the Cause
- Extended sideways range at the highs
- Institutions gradually sell to eager public buyers
- Multiple tests of support and resistance
- Volume higher on down moves (distribution)
Phase C: The Upthrust
- UTAD (Upthrust After Distribution): False breakout above the range
- Traps breakout buyers and triggers their stop losses
- Institutions sell remaining positions at premium prices
- Price quickly reverses back into the range
Phase D: Markdown Begins
- SOW (Sign of Weakness): Sharp decline on high volume
- LPSY (Last Point of Supply): Weak rally on low volume
- This is the secondary short entry
Volume Analysis in Wyckoff
Accumulation Volume Clues
- Volume decreases on tests of support (less selling pressure)
- Volume increases on rallies (buying interest)
- Climactic volume at SC marks the low
Distribution Volume Clues
- Volume increases on drops (selling pressure)
- Volume decreases on rallies (less buying interest)
- Climactic volume at BC marks the high
Trading the Wyckoff Method
Best Entry: The Spring
- Identify a trading range with Wyckoff characteristics
- Wait for the spring (false breakdown below support)
- Enter long when price recovers back above the range
- Stop below the spring low
- Target the upper boundary, then the SOS level
Best Entry: The UTAD
- Identify distribution range characteristics
- Wait for UTAD (false breakout above resistance)
- Enter short when price falls back below the range
- Stop above the UTAD high
- Target the lower boundary, then the SOW level
Key Takeaways
- Institutions accumulate at lows and distribute at highs
- The spring and UTAD are the highest probability entry signals
- Volume analysis confirms accumulation vs distribution
- Patience is essential, Wyckoff patterns take time to develop
- Combine with support/resistance and candlestick patterns for precision
Lesson Discussion