
Divergence Trading Complete Guide
Divergence is one of the most powerful leading signals in technical analysis. When price and an indicator disagree, a change in direction is likely.
What is Divergence?
Divergence occurs when the price chart makes a certain move (higher high or lower low) but the indicator fails to confirm that move. This disagreement signals weakening momentum.
Types of Divergence
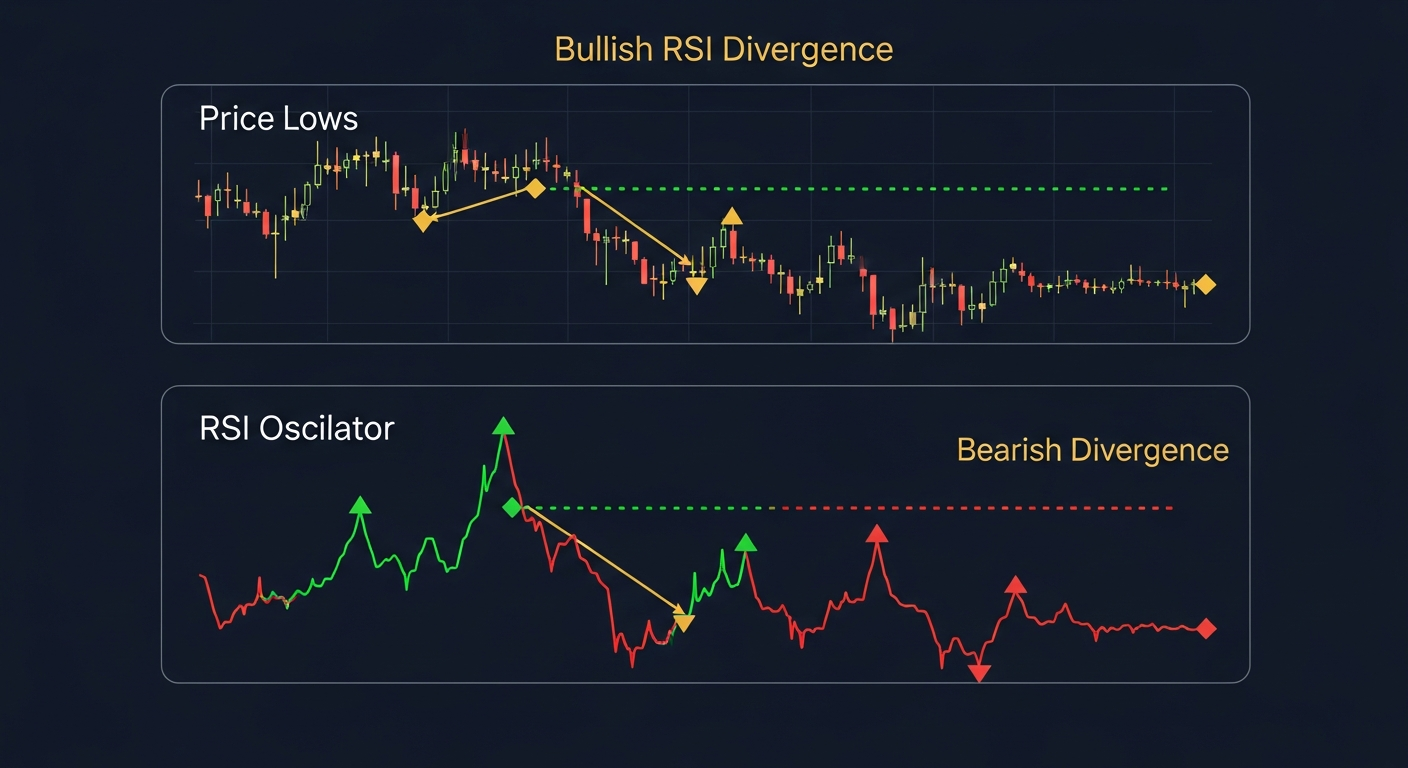
Regular Bullish Divergence
- Price makes a lower low
- Indicator makes a higher low
- Signal: Bearish momentum is fading
- Action: Prepare for a potential upward reversal
- Found at market bottoms
Regular Bearish Divergence
- Price makes a higher high
- Indicator makes a lower high
- Signal: Bullish momentum is fading
- Action: Prepare for a potential downward reversal
- Found at market tops
Hidden Bullish Divergence
- Price makes a higher low
- Indicator makes a lower low
- Signal: Uptrend will continue after a pullback
- Action: Look for buying opportunities
- Confirms the existing uptrend
Hidden Bearish Divergence
- Price makes a lower high
- Indicator makes a higher high
- Signal: Downtrend will continue after a rally
- Action: Look for selling opportunities
- Confirms the existing downtrend
Best Indicators for Divergence
RSI (Relative Strength Index)
- Most popular for divergence trading
- Use 14-period setting (standard)
- Clearest signals at overbought (70+) and oversold (30-) zones
- Divergence at these extremes is most powerful
MACD Histogram
- Histogram divergence is very powerful and often leads price
- Works well on all timeframes
- Signal line crossover adds confirmation
- Look for divergence between histogram peaks/valleys
Stochastic Oscillator
- Sensitive oscillator, produces frequent divergence signals
- Best on higher timeframes (4H, daily) to reduce noise
- Use the slow stochastic (14,3,3) for cleaner signals
- Most reliable when combined with RSI
CCI (Commodity Channel Index)
- Good for trending markets
- Extreme levels (above 100 or below -100) produce best divergence
- Less common but effective
Trading Rules for Divergence
Entry Strategy
- Identify the divergence on your preferred indicator
- Wait for price to confirm the reversal (do not enter on divergence alone)
- Look for a candlestick reversal pattern at the divergence point
- Enter on the confirmation candle close
- Place your stop beyond the divergence swing point
Confirmation Methods
- Trendline break on the price chart
- Moving average crossover
- Break of recent structure (swing high/low)
- Volume increase on the reversal candle
Risk Management
- Stop loss beyond the extreme of the divergence swing
- Target the nearest significant support/resistance
- Minimum 1:2 risk-to-reward ratio
- Scale out at key levels
Multi-Timeframe Divergence
The Power of Alignment
- Daily divergence + 4H divergence = very strong signal
- Use higher timeframe for direction, lower timeframe for entry
- Never trade lower timeframe divergence against higher timeframe trend
Common Mistakes
- Entering immediately on divergence without price confirmation
- Trading divergence on very short timeframes (1-5 minute charts)
- Ignoring the overall trend context
- Not waiting for the indicator to actually diverge (comparing wrong swing points)
- Using too many indicators - one or two is sufficient
Key Takeaways
- Regular divergence signals reversals, hidden divergence signals continuation
- RSI and MACD are the most reliable indicators for divergence
- Always wait for price confirmation before entering
- Multi-timeframe divergence produces the strongest signals
- Divergence is a warning signal, not a guaranteed reversal
Lesson Discussion