
ADX Trend Strength Mastery
The Average Directional Index (ADX) tells you HOW STRONG a trend is, not its direction. Combined with +DI and -DI, it becomes a complete trend-following system.
Understanding ADX Components
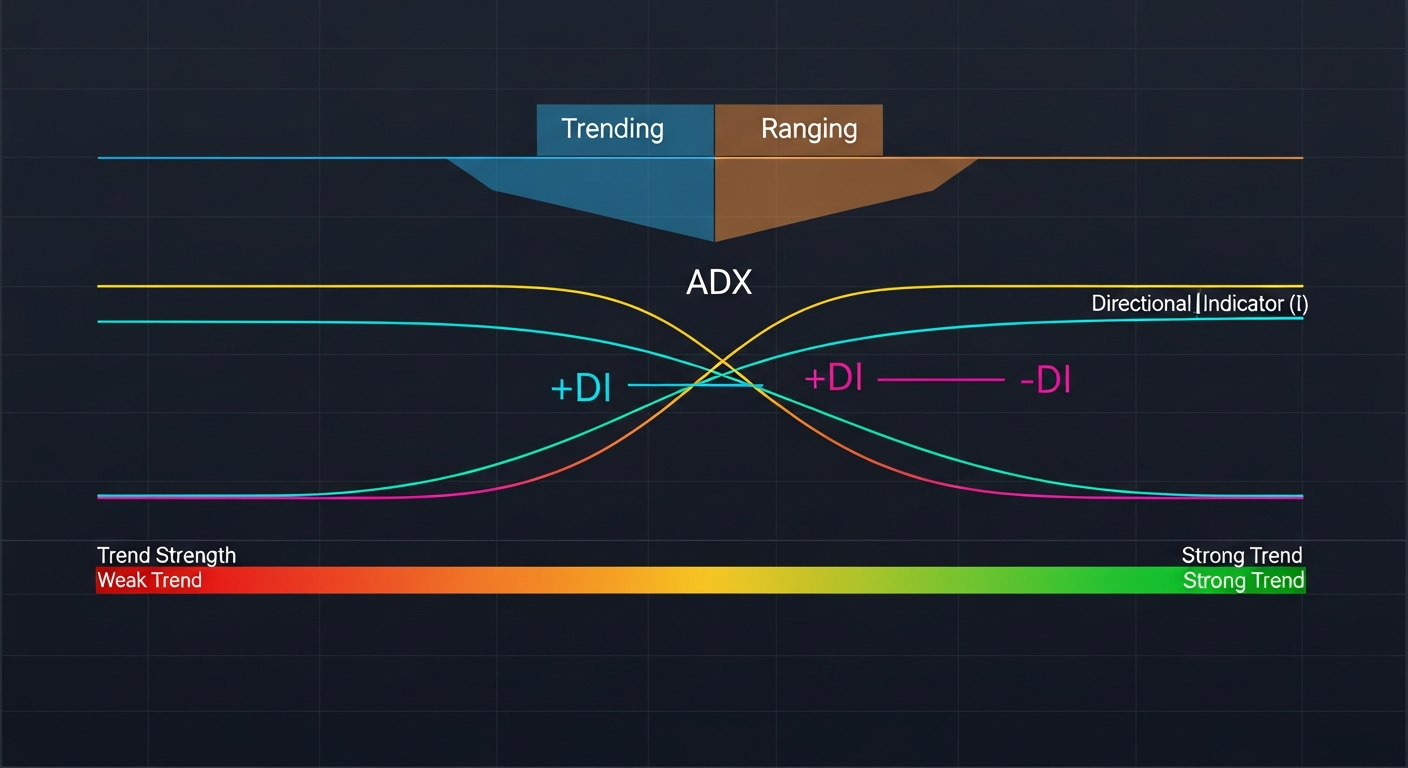
ADX Line (Trend Strength)
- Ranges from 0 to 100
- Below 20 = No trend / weak trend (ranging market)
- 20-25 = Trend emerging
- 25-50 = Strong trend
- 50-75 = Very strong trend
- Above 75 = Extremely strong trend (rare, watch for exhaustion)
+DI Line (Positive Directional Indicator)
- Measures upward price movement strength
- When +DI is above -DI = Bullish pressure dominates
- Rising +DI = Increasing buying pressure
-DI Line (Negative Directional Indicator)
- Measures downward price movement strength
- When -DI is above +DI = Bearish pressure dominates
- Rising -DI = Increasing selling pressure
Trading Signals
Bullish Signal
- +DI crosses above -DI
- ADX is above 20 (or rising toward 25)
- ADX line is rising (trend strengthening)
- Enter long with stop below recent swing low
Bearish Signal
- -DI crosses above +DI
- ADX is above 20 (or rising toward 25)
- ADX line is rising
- Enter short with stop above recent swing high
Avoid When
- ADX below 20: Market is ranging, no trend
- ADX falling from high level: Trend weakening
- +DI and -DI intertwined: Choppy, no clear direction
Advanced ADX Strategies
ADX Breakout Strategy
- Wait for ADX below 20 for extended period
- This means energy is building (compression)
- When ADX rises above 20, a new trend is starting
- Enter in direction of +DI vs -DI crossover
- Ride until ADX starts declining from above 40
ADX Trend Filter
- Only take buy setups when ADX > 25 and +DI > -DI
- Only take sell setups when ADX > 25 and -DI > +DI
- Skip all signals when ADX < 20
- This alone eliminates most losing trades in ranging markets
ADX Divergence
- Price making higher highs but ADX declining
- Signals trend exhaustion approaching
- Prepare for potential reversal or consolidation
- Tighten stops, take partial profits
Settings Optimization
Default Period: 14
- Good for most timeframes and instruments
- Shorter period (7-10): More sensitive, more signals, more noise
- Longer period (20-25): Smoother, fewer signals, more reliable
Best Timeframes
- Daily: Most reliable trend signals
- 4-Hour: Good for swing trading
- 1-Hour: Useful with longer ADX period
- Avoid on very short timeframes (noise)
Combining with Other Tools
ADX + Moving Averages
- Use ADX to confirm MA crossover signals
- Only trade MA crossovers when ADX > 25
- Drastically reduces false signals
ADX + RSI
- ADX confirms trend, RSI finds entries
- In uptrend (ADX>25, +DI>-DI): Buy RSI pullbacks to 40-50
- In downtrend (ADX>25, -DI>+DI): Sell RSI bounces to 50-60
Key Takeaways
- ADX measures trend STRENGTH, not direction
- Below 20 = ranging, above 25 = trending
- +DI above -DI = bullish, -DI above +DI = bearish
- Rising ADX = strengthen trend, falling ADX = weakening
- Use as a filter to avoid trading in choppy markets
Lesson Discussion