
Parabolic SAR Trading System
The Parabolic Stop and Reverse (SAR) is a trend-following indicator that provides potential entry and exit points, acting as a dynamic trailing stop.
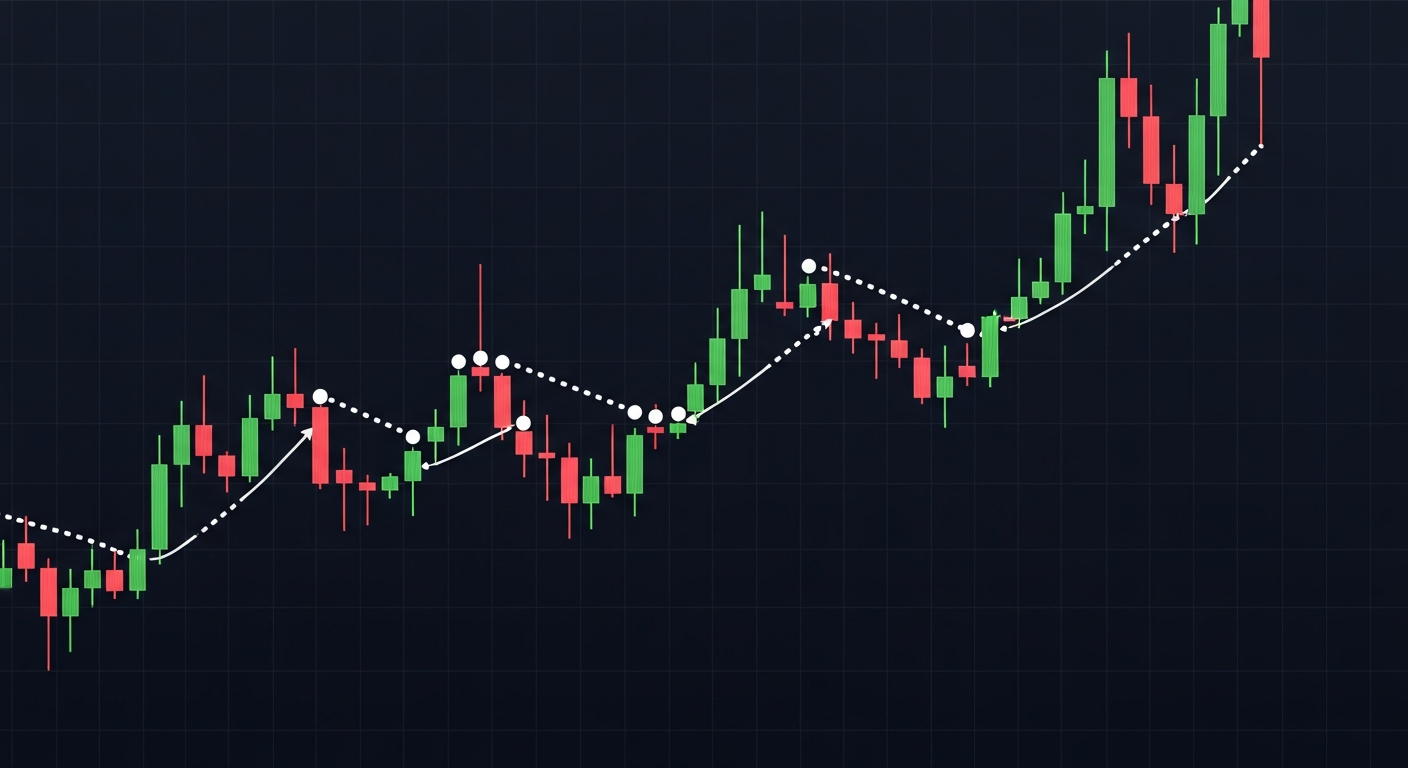
How Parabolic SAR Works
The Dots
- Dots appear below price during uptrends
- Dots appear above price during downtrends
- When dots flip sides = potential trend reversal
- Dots accelerate toward price over time
The Acceleration Factor
- Starts at 0.02 (default)
- Increases by 0.02 each time a new high/low is made
- Maximum acceleration: 0.20 (default)
- Higher acceleration = dots closer to price = tighter stops
Reading the Signals
Buy Signal
- Dots flip from above price to below
- Confirms uptrend beginning
- Enter long at the candle where dots switch
- Use the SAR dot as your trailing stop
Sell Signal
- Dots flip from below price to above
- Confirms downtrend beginning
- Enter short at the candle where dots switch
- Use the SAR dot as your trailing stop
Trailing Stop Management
- SAR dot moves with each new candle
- In uptrend: dot rises, never falls
- In downtrend: dot falls, never rises
- Exit when price touches the dot
Trading Strategies
Pure SAR Strategy
- Enter long when dots flip below price
- Hold until dots flip above price
- Then reverse: go short
- Always in the market (reversal system)
- Works best in strongly trending markets
SAR + Trend Filter Strategy
- Determine main trend with 200 EMA
- Price above 200 EMA: Only take SAR buy signals
- Price below 200 EMA: Only take SAR sell signals
- This filters out many false reversals
- Significantly improves win rate
SAR for Exit Management Only
- Enter trades using your preferred method
- Use SAR dots purely as a trailing stop
- Move stop to SAR dot level each period
- Captures big trends while protecting profits
- No decision-making needed for exits
Optimizing Settings
Conservative Settings (0.01, 0.10)
- Dots further from price
- Fewer false signals
- Wider stops, larger drawdowns
- Better for volatile markets
Aggressive Settings (0.03, 0.30)
- Dots closer to price
- More frequent signals
- Tighter stops, smaller individual losses
- Better for less volatile, trending markets
Limitations
When SAR Fails
- Ranging/choppy markets cause constant whipsaws
- Each flip generates a losing trade in sideways markets
- No way to set a fixed stop loss (SAR starts far from entry)
- Initial risk can be large when trend starts
Solutions
- Combine with ADX: Only trade SAR when ADX > 25
- Use moving average filter for trend direction
- Skip signals in known consolidation zones
- Use on higher timeframes for fewer false signals
Key Takeaways
- SAR dots below price = uptrend, above = downtrend
- Dot flips signal potential reversals
- Best used as a trailing stop system
- Combine with trend filters to avoid whipsaws
- Works best in trending markets, avoid in ranges
Lesson Discussion