
Divergence Trading Mastery
Divergence between price and indicators is one of the most reliable early warning signals for trend reversals.
What is Divergence?
Divergence occurs when price action moves in one direction while a technical indicator moves in the opposite direction. This disagreement signals that the current trend is weakening.
Regular Divergence (Reversal Signal)
Regular Bullish Divergence
- Price: Makes a lower low
- Indicator: Makes a higher low
- Signal: Bearish momentum is fading
- Action: Prepare for potential upward reversal
Regular Bearish Divergence
- Price: Makes a higher high
- Indicator: Makes a lower high
- Signal: Bullish momentum is fading
- Action: Prepare for potential downward reversal
Hidden Divergence (Continuation Signal)
Hidden Bullish Divergence
- Price: Makes a higher low
- Indicator: Makes a lower low
- Signal: Uptrend will continue
- Action: Look for buying opportunities on pullbacks
Hidden Bearish Divergence
- Price: Makes a lower high
- Indicator: Makes a higher high
- Signal: Downtrend will continue
- Action: Look for selling opportunities on rallies
Best Indicators for Divergence
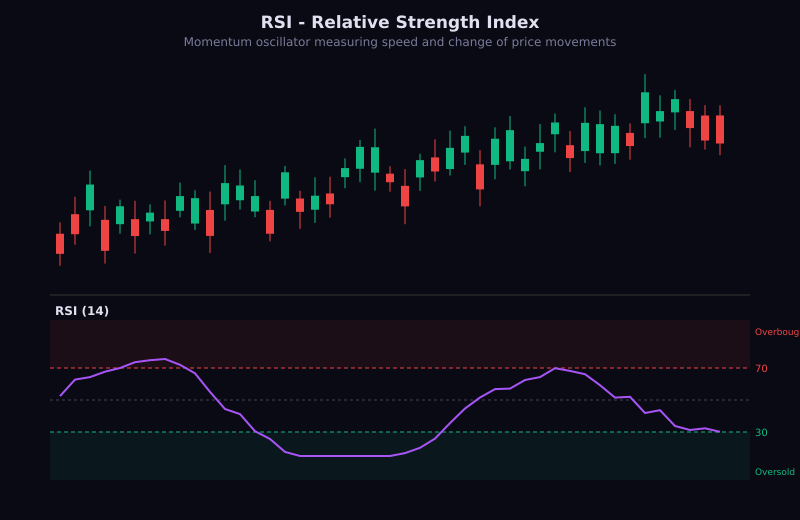
RSI (Relative Strength Index)
- Most popular for divergence trading
- Best in 14-period setting
- Clear signals at overbought/oversold
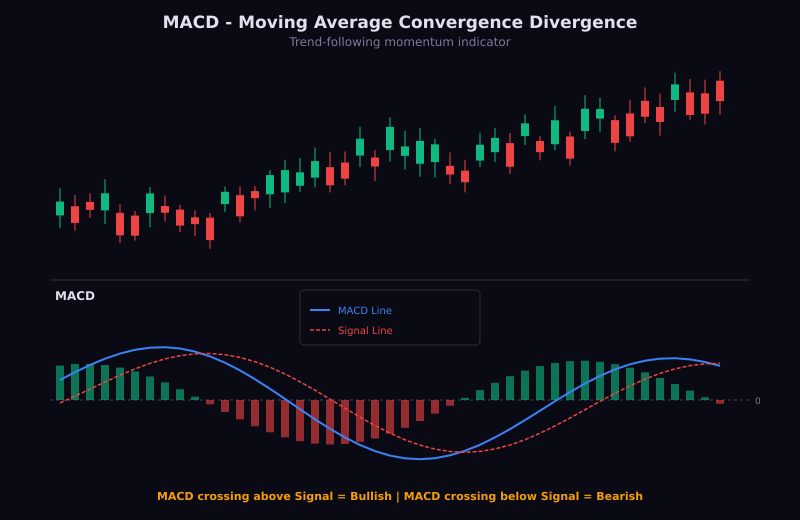
MACD
- Histogram divergence is very powerful
- Signal line crossover confirms
- Works well on all timeframes
Stochastic Oscillator
- Fast signals, sometimes too noisy
- Best on higher timeframes
- Use slow stochastic for cleaner signals
CCI (Commodity Channel Index)
- Good for trending markets
- Extreme readings + divergence = strong signal
Trading Strategy
Entry Rules
- Identify divergence on your chosen indicator
- Wait for price to reach a key support/resistance level
- Look for a candlestick confirmation pattern
- Enter trade after confirmation candle closes
- Never enter on divergence alone
Stop Loss
- Place below/above the most recent swing point
- Give enough room for final push before reversal
- Typically 1-2 ATR beyond the divergence swing
Take Profit
- TP1: Previous swing high/low
- TP2: Key support/resistance level
- TP3: Fibonacci extension of the reversal
Divergence Strength Ranking
- Strongest: Divergence on weekly/daily chart
- Strong: Divergence at key S/R + candlestick pattern
- Moderate: Divergence on 4H chart with trend change
- Weak: Divergence on lower timeframes alone
Common Mistakes
- Trading divergence in strong trends (it can persist)
- Not waiting for confirmation
- Using too many indicators simultaneously
- Ignoring the broader market context
- Setting stops too tight on divergence trades
Key Takeaways
- Regular divergence warns of reversals
- Hidden divergence confirms continuations
- Always wait for price confirmation
- Higher timeframes produce more reliable signals
- Combine with support/resistance for best results
Lesson Discussion