Elliott Wave Advanced Structures
Beyond the basic 5-3 pattern, Elliott Wave Theory includes complex corrective structures and extension patterns that appear frequently in real markets.
Wave Extensions
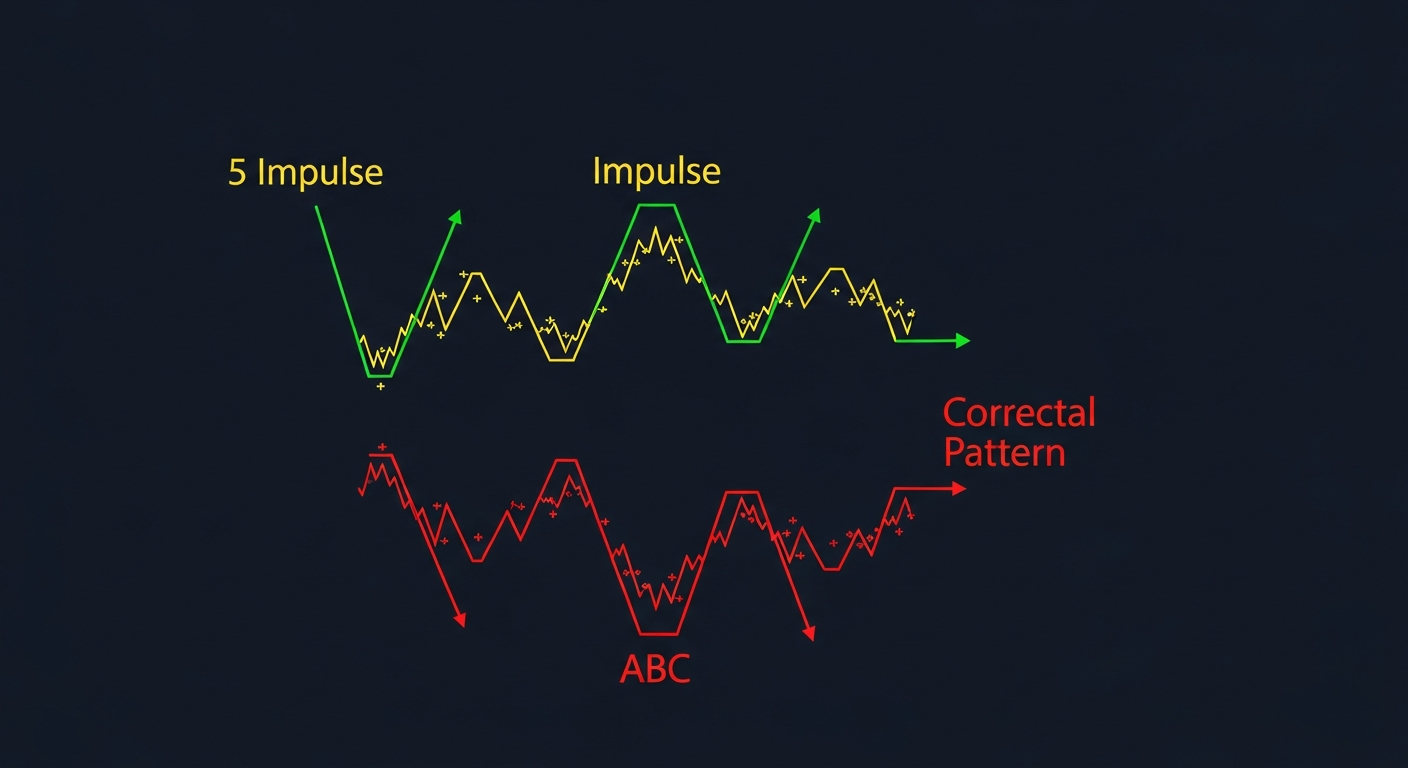
What is an Extension?
- One of the impulse waves (1, 3, or 5) becomes elongated
- Extended waves contain their own 5-wave sub-structure
- The extended wave is typically 161.8% or more of the other impulse waves
Wave 3 Extension (Most Common)
- Wave 3 extends to 161.8-261.8% of Wave 1
- The sub-waves of Wave 3 are clearly visible
- This creates a total of 9 visible waves in the impulse
- Most profitable extension to trade
Wave 5 Extension
- Less common but occurs in commodities and forex
- Wave 5 exceeds the length of Wave 3
- Often appears in commodity markets like gold and oil
- Can create dramatic "blow-off" tops
Wave 1 Extension
- Rarest extension
- When Wave 1 is the longest
- Waves 3 and 5 tend to be shorter
- Can be difficult to identify in real-time
Complex Corrective Patterns
Zigzag (Sharp Correction)
- Structure: A-B-C (5-3-5)
- Wave A is a 5-wave impulse
- Wave B retraces 38.2-78.6% of A
- Wave C is a 5-wave impulse in the same direction as A
- Typically retraces 50-61.8% of the prior impulse
Double Zigzag (WXY)
- Two zigzags connected by a linking wave (X)
- Structure: W-X-Y where each W and Y are zigzags
- Occurs when one zigzag is not deep enough
- Creates a deeper, more complex correction
Flat Correction
- Structure: A-B-C (3-3-5)
- Wave A is a 3-wave structure (not 5)
- Wave B retraces nearly 100% of A
- Wave C is a 5-wave impulse
- Three types: Regular, Expanded, Running
Expanded Flat
- Wave B exceeds the start of Wave A
- Wave C extends beyond the end of Wave A
- Creates a "whopping" correction
- Very common in real markets
Triangle (Wedge Correction)
- Structure: A-B-C-D-E (3-3-3-3-3)
- Converging trendlines
- Only appears in Wave 4 or Wave B positions
- Signals that the final wave (5 or C) is coming
- The thrust after a triangle is usually swift and decisive
Alternation Principle
Rule of Alternation
- If Wave 2 is a sharp correction (zigzag), Wave 4 will be flat or complex
- If Wave 2 is flat or complex, Wave 4 will be sharp
- This helps predict the type of correction to expect
- Not a rule but a strong guideline
Fibonacci and Wave Relationships
Common Ratios
- Wave 2: Retraces 50%, 61.8%, or 78.6% of Wave 1
- Wave 3: 161.8% or 261.8% of Wave 1
- Wave 4: Retraces 23.6% or 38.2% of Wave 3
- Wave 5: 61.8% or 100% of Wave 1
- Wave C: 100% or 161.8% of Wave A
Time Relationships
- Wave 3 often lasts 161.8% of Wave 1's duration
- Wave 5 often equals Wave 1's duration
- Corrections often last 38.2-61.8% of the prior impulse duration
Practical Application
Identifying the Wave Count
- Start on the weekly or monthly chart
- Identify the largest wave structure
- Work down to daily and 4H for sub-waves
- Verify that your count follows all three rules
- Use the alternation principle to predict correction types
When Multiple Counts are Possible
- Maintain a primary and alternate count
- Define price levels that invalidate each count
- Trade the count that aligns with the trend
- Update your count as new price data arrives
Key Takeaways
- Wave 3 extensions are the most common and most profitable
- Complex corrections (flats, triangles) appear more often than simple zigzags
- The alternation principle helps predict correction types
- Triangles only appear in Wave 4 or Wave B and signal the final thrust
- Maintain primary and alternate wave counts to stay flexible
Lesson Discussion