
Flag, Pennant, and Wedge Patterns
Continuation patterns signal that the existing trend is likely to resume after a brief pause.
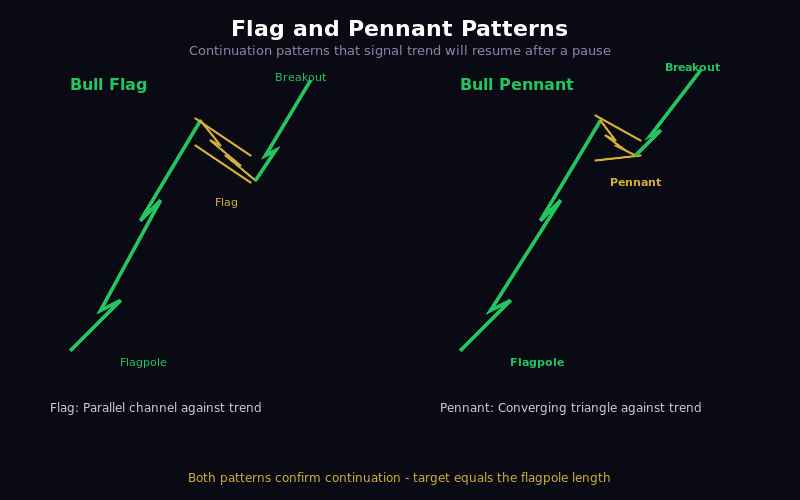
Bull Flag Pattern
A bullish continuation pattern after a strong move up.
Structure
- Flagpole: Strong, steep price advance with high volume
- Flag: Small rectangular consolidation that slopes against the trend (downward)
- Breakout: Price breaks above the flag with volume
Measuring Target
- Measure the height of the flagpole
- Add that distance to the breakout point
- This gives your minimum price target
Trading Rules
- Wait for a strong impulse move (flagpole)
- Let price consolidate in a channel
- Enter on breakout above the flag
- Stop loss below the flag low
- Target: flagpole height projected from breakout
Bear Flag Pattern
The mirror image of a bull flag:
- Flagpole: Sharp decline
- Flag: Small upward-sloping consolidation
- Breakout: Price breaks below the flag
Pennant Pattern
Structure
- Pole: Strong price move (similar to flag)
- Pennant: Converging trendlines (triangle shape)
- Breakout: Price exits the triangle in trend direction
Key Differences from Flags
- Flag has parallel lines, pennant has converging lines
- Pennant typically has declining volume during formation
- Breakout is usually earlier (within 1-3 weeks)
Rising Wedge
Bearish Signal
- Both trendlines slope upward
- Upper trendline is flatter than lower
- Price makes higher highs and higher lows but at a decreasing rate
- Breaks down eventually
Trading Strategy
- Short on break below lower trendline
- Stop above recent swing high
- Target: height of widest part of wedge
Falling Wedge
Bullish Signal
- Both trendlines slope downward
- Lower trendline is flatter than upper
- Converging pattern with decreasing range
- Breaks up eventually
Trading Strategy
- Buy on break above upper trendline
- Stop below recent swing low
- Target: height of widest part of wedge
Volume Confirmation
During Formation
- Volume should decrease as pattern forms
- Shows consolidation, not distribution
On Breakout
- Volume should increase significantly
- 50%+ above average volume is ideal
- Low volume breakouts often fail
Best Practices
- Look for flags in strong trending markets
- Wait for the breakout - do not anticipate
- Flags that form for 1-3 weeks are most reliable
- Use the flagpole to set your profit target
- Always check volume for confirmation
Lesson Discussion