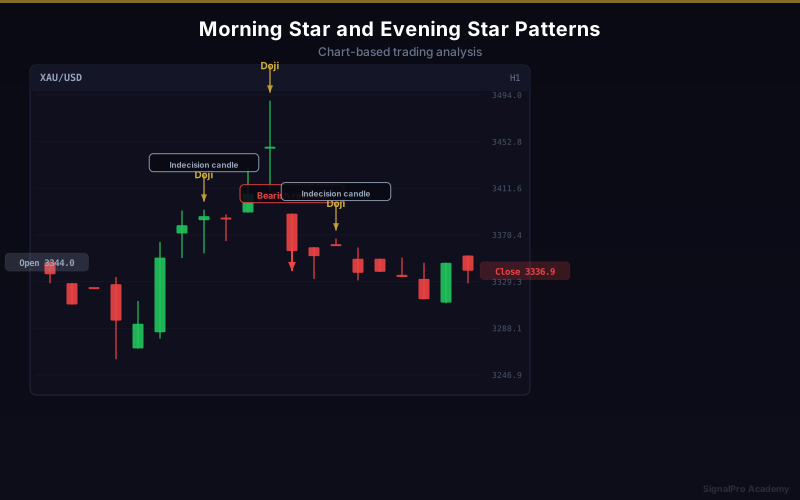
Morning Star and Evening Star Patterns
These three-candle patterns are among the most reliable reversal signals in candlestick analysis.
Morning Star Pattern
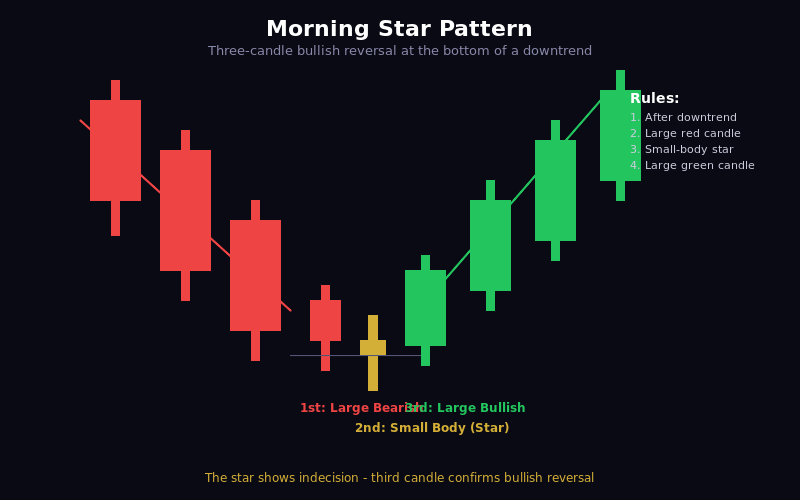
A bullish reversal pattern found at the bottom of a downtrend.
Structure
- First Candle: Large bearish (red) candle confirming the downtrend
- Second Candle: Small body candle (the "star") that gaps down, showing indecision
- Third Candle: Large bullish (green) candle that closes above the midpoint of the first candle
What It Means
- Sellers are exhausted (first candle shows last push)
- Market reaches indecision (star shows balance)
- Buyers take control (third candle confirms reversal)
Trading the Morning Star
- Entry: After third candle closes
- Stop Loss: Below the low of the star candle
- Target: Previous resistance or 1:2 risk-reward minimum
- Confirmation: Higher volume on the third candle
Evening Star Pattern
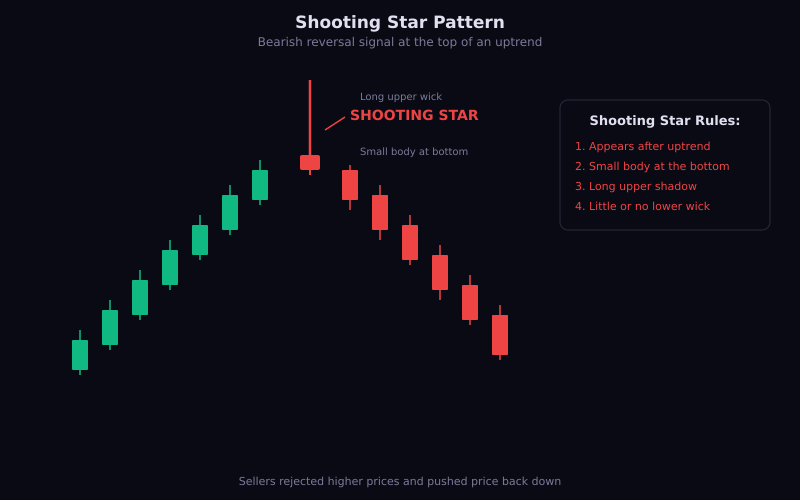
A bearish reversal pattern found at the top of an uptrend - the mirror image of morning star.
Structure
- First Candle: Large bullish (green) candle confirming uptrend
- Second Candle: Small body candle that gaps up (the "star")
- Third Candle: Large bearish (red) candle closing below midpoint of first candle
Trading the Evening Star
- Entry: After third candle closes
- Stop Loss: Above the high of the star candle
- Target: Previous support level
Variations
Doji Star
- When the middle candle is a doji (cross shape)
- Even stronger signal due to extreme indecision
- Called "Morning Doji Star" or "Evening Doji Star"
Abandoned Baby
- Gaps exist on both sides of the star candle
- Very rare but extremely reliable
- Strongest version of the star pattern
Improving Accuracy
Key Filters
- Must occur at the end of a clear trend
- Third candle should close above/below midpoint of first
- Higher volume on third candle increases reliability
- Look for the pattern at key support/resistance levels
- Works best on daily and 4H timeframes
Common Mistakes
- Trading the pattern in a sideways market
- Not waiting for the third candle to close
- Ignoring the overall trend context
- Setting stops too tight
Practice Tips
- Scan daily charts for recent examples
- Note which timeframe produced the best results
- Combine with support/resistance for confluence
- Track your win rate with this pattern
Lesson Discussion