
How to Read Stock Charts
Chart reading is essential for timing your stock trades effectively.
Chart Types
Line Chart
- Connects closing prices
- Simplest view of trend
- Good for long-term overview
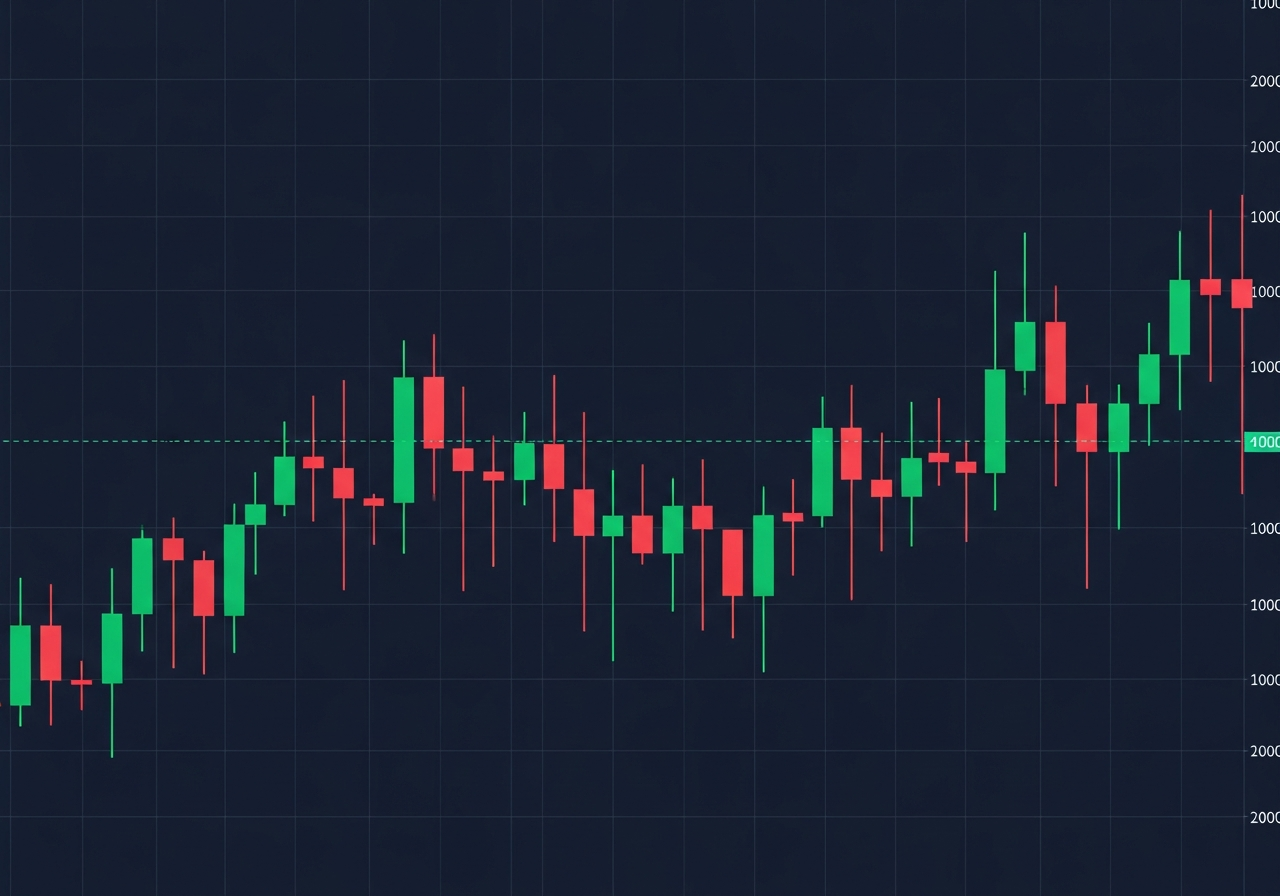
Candlestick Chart
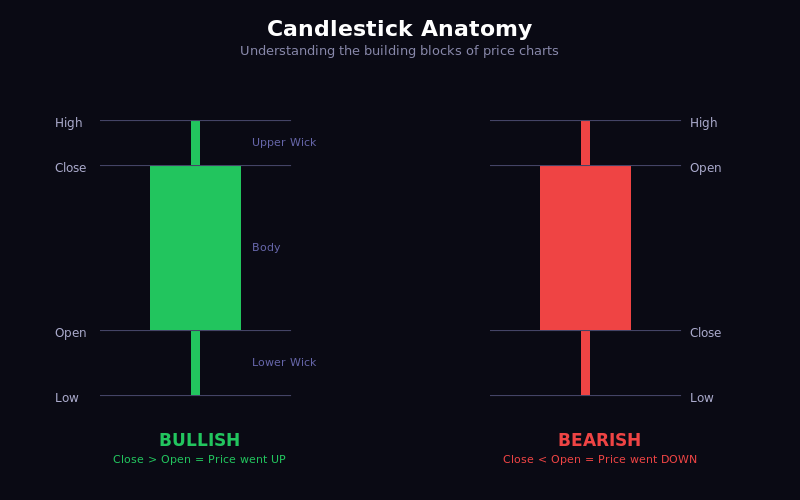

- Shows open, high, low, close
- Most popular among traders
- Reveals price action and sentiment
Bar Chart (OHLC)
- Similar info to candlesticks
- Different visual presentation
- Used by some traditional traders
Key Chart Elements
Price Scale
- Y-axis shows price
- Linear vs logarithmic
- Use log scale for long-term charts
Volume
- Bars at bottom of chart
- Confirms price movements
- High volume = conviction
- Low volume = weak move
Time Scale
- X-axis shows time
- Multiple timeframes available
- Daily most popular for stocks
Reading Price Action
Trends
- Uptrend: Higher highs, higher lows
- Downtrend: Lower highs, lower lows
- Sideways: Range-bound
Support and Resistance
- Support: Where buyers step in
- Resistance: Where sellers appear
- Previous highs/lows are key levels
Volume Analysis
- Rising price + rising volume = strong
- Rising price + falling volume = weak
- Volume spike on breakout = confirmation
Common Indicators for Stocks
Moving Averages
- 50-day MA: Medium-term trend
- 200-day MA: Long-term trend
- Price above both = bullish
Relative Strength
- Compare stock to index
- Outperforming = strong
- Underperforming = weak
Tips for Beginners
- Start with daily charts
- Focus on volume and price
- Less indicators is more
- Context matters more than patterns
Lesson Discussion