
Ichimoku Cloud Trading
Ichimoku Kinko Hyo ("one glance equilibrium chart") is a comprehensive indicator system that shows support, resistance, trend direction, momentum, and trade signals all in one view.
The Five Lines
Tenkan-Sen (Conversion Line)
- 9-period midpoint (highest high + lowest low / 2)
- Fast-moving line
- Shows short-term trend
- Similar to a 9-period moving average
Kijun-Sen (Base Line)
- 26-period midpoint
- Slower line
- Shows medium-term trend
- Acts as support/resistance
Senkou Span A (Leading Span A)
- Average of Tenkan and Kijun, plotted 26 periods ahead
- Forms one boundary of the cloud
- Future support/resistance reference
Senkou Span B (Leading Span B)
- 52-period midpoint, plotted 26 periods ahead
- Forms other boundary of the cloud
- Strongest support/resistance
Chikou Span (Lagging Span)
- Current close plotted 26 periods back
- Confirms trend when compared to past price
- Above past price = bullish
The Cloud (Kumo)
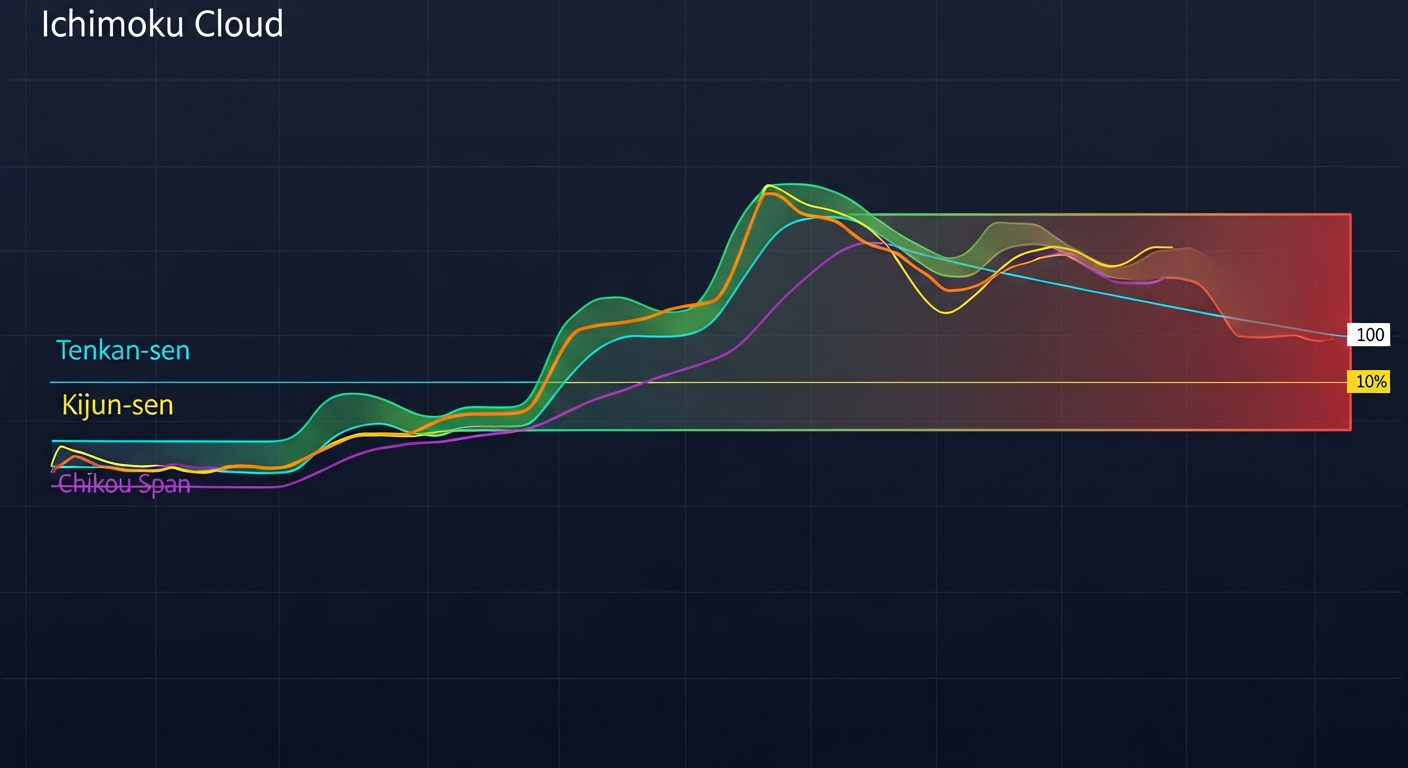
The shaded area between Senkou Span A and B:
- Green cloud (Span A above Span B): Bullish
- Red cloud (Span B above Span A): Bearish
- Cloud thickness: Indicates support/resistance strength
- Cloud twist: Potential trend change
Trading Signals
Strong Buy Signal
- Price above the cloud
- Tenkan crosses above Kijun
- Chikou Span above past price
- Cloud is green and expanding
- All five confirmations aligned
Strong Sell Signal
- Price below the cloud
- Tenkan crosses below Kijun
- Chikou Span below past price
- Cloud is red and expanding
TK Cross
- Tenkan crosses above Kijun = bullish
- Tenkan crosses below Kijun = bearish
- Strongest when above/below cloud respectively
Kumo Breakout
- Price breaking above cloud = bullish
- Price breaking below cloud = bearish
- Thick cloud = harder to break through
- Thin cloud = easier breakout
Ichimoku Trading Strategy
Entry Rules
- Confirm trend direction with cloud color
- Wait for TK cross in trend direction
- Price must be on correct side of cloud
- Chikou Span must confirm
- Enter on pullback to Kijun-Sen
Stop Loss
- Place below Kijun-Sen for buy trades
- Below the cloud for trend trades
- Below recent swing low
Take Profit
- Next cloud boundary
- Key swing high/low
- When opposing TK cross appears
Practical Tips
- Works best on daily and 4H charts
- Avoid when price is inside the cloud (choppy)
- Cloud thickness indicates conviction level
- Multiple timeframe analysis enhances signals
- Combine with candlestick patterns for timing
Lesson Discussion