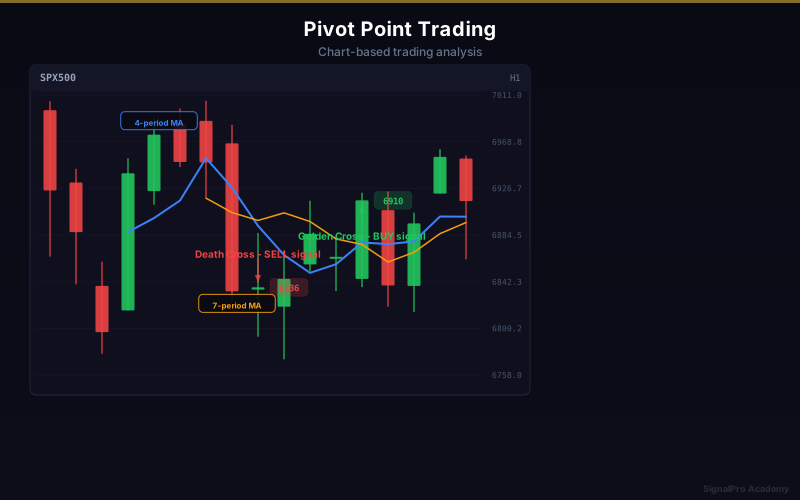
Pivot Point Trading
Pivot points are calculated support and resistance levels used by professional floor traders and institutions to identify key price levels each day.
What are Pivot Points?
Pivot points use the previous period's high, low, and close to calculate support and resistance levels for the current period.
Standard Pivot Point Calculation
Central Pivot Point (PP)
- PP = (High + Low + Close) / 3
Support Levels
- S1 = (2 x PP) - High
- S2 = PP - (High - Low)
- S3 = Low - 2 x (High - PP)
Resistance Levels
- R1 = (2 x PP) - Low
- R2 = PP + (High - Low)
- R3 = High + 2 x (PP - Low)
Types of Pivot Points
Standard (Floor Trader)
- Most commonly used
- Simple calculation
- Good for range-bound markets
Fibonacci Pivots
- Uses Fibonacci ratios
- More precise levels
- Preferred by many professional traders
Camarilla Pivots
- Closer to current price
- Good for scalping
- Four levels of support and resistance
Woodie's Pivots
- Gives more weight to closing price
- Slightly different levels
- Useful for open-based strategies
Trading Strategies
Bounce Strategy
- Price approaches a pivot level
- Watch for rejection (candlestick pattern)
- Enter in the bounce direction
- Stop beyond the pivot level
- Target the next pivot level
Breakout Strategy
- Price approaches a pivot level
- Watch for a strong break through
- Enter in the breakout direction
- Stop below the broken level
- Target the next pivot level
Central Pivot Range Strategy
- If price opens above PP: Bullish bias for the day
- If price opens below PP: Bearish bias for the day
- PP acts as the day's equilibrium
Pivot Point as Market Context
Bullish Day Setup
- Price holding above PP
- R1 and R2 are targets
- Dips to PP are buying opportunities
Bearish Day Setup
- Price holding below PP
- S1 and S2 are targets
- Rallies to PP are selling opportunities
Timeframes for Pivots
- Daily Pivots: Most popular, used by day traders
- Weekly Pivots: Used by swing traders
- Monthly Pivots: Used by position traders
- Higher timeframe pivots carry more weight
Key Takeaways
- Pivot points give you predefined levels each day
- No subjective drawing of lines needed
- Widely watched by institutional traders
- Combine with other analysis for best results
- Trade bounces and breakouts at pivot levels
Lesson Discussion