
Point and Figure Charting
Point and Figure (P&F) charts are the oldest form of technical analysis, filtering out all time-based noise to show pure supply and demand dynamics with built-in price targets.
How P&F Charts Work
The Basics
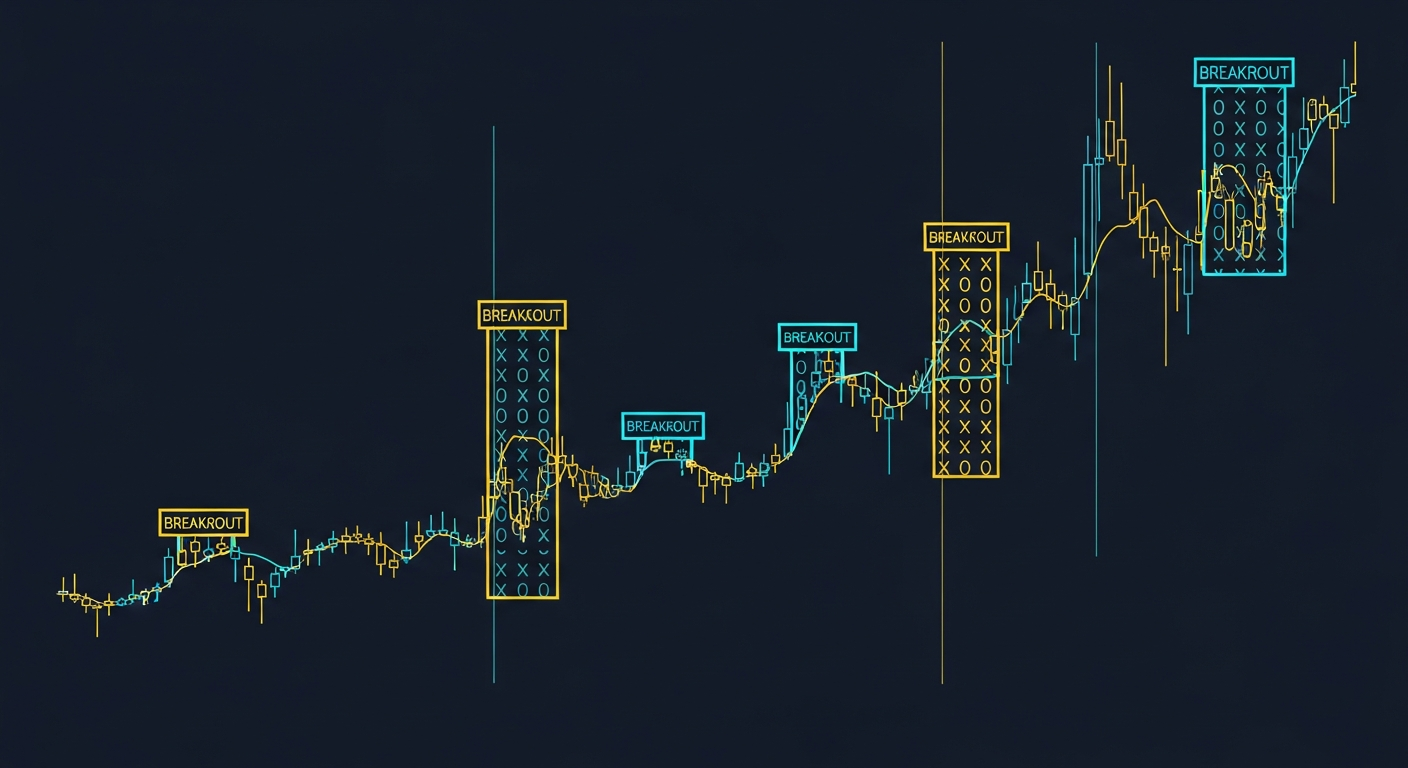
- X columns represent rising prices (demand)
- O columns represent falling prices (supply)
- Each X or O represents a fixed price movement (box size)
- A reversal requires a minimum number of boxes in opposite direction
- Time is completely irrelevant
Box Size
- Determines sensitivity of the chart
- Smaller boxes = more detail, more columns
- Larger boxes = smoother, bigger picture
- For EUR/USD: 10-20 pips per box for swing trading
- For stocks: Often 1-point or percentage-based
Reversal Amount
- Most common: 3-box reversal
- Price must move 3 boxes in opposite direction to start new column
- 1-box reversal: Very detailed (point and figure scalping)
- 5-box reversal: Big picture, major trends only
P&F Chart Patterns
Double Top Breakout (Bullish)
- X column rises to same level as previous X column
- Then exceeds it by one box
- Breakout above the resistance level
- Buy signal with stop at recent O column low
Double Bottom Breakdown (Bearish)
- O column falls to same level as previous O column
- Then exceeds it by one box
- Breakdown below support
- Sell signal with stop at recent X column high
Triple Top Breakout
- Three X columns reaching same resistance level
- Fourth attempt breaks through
- Stronger signal than double top (tested 3 times)
- High probability bullish breakout
Triple Bottom Breakdown
- Three O columns reaching same support level
- Fourth attempt breaks through
- Strong bearish signal
Catapult Pattern
- Triple top forms, breaks out
- Pulls back but holds above previous breakout
- Then continues higher
- Very high probability continuation pattern
Price Targets
Horizontal Count
- Measure the width of a consolidation pattern
- Count the number of columns in the pattern
- Multiply by box size and reversal amount
- Add to (or subtract from) the breakout level
- This gives your measured move target
Vertical Count
- Count the number of Xs in the breakout column
- Multiply by box size and reversal amount
- Add to the bottom of the column
- Quick target calculation method
Support and Resistance on P&F
Trendlines
- 45-degree bullish support lines drawn from lows
- 45-degree bearish resistance lines drawn from highs
- Price respecting these angles = trend intact
- Break of trendline = potential trend change
Horizontal Levels
- Support/resistance is clearer than any other chart type
- Multiple Os stopping at same level = strong support
- Multiple Xs stopping at same level = strong resistance
- No wicks or shadows to confuse the picture
Advantages of P&F
Why Traders Use It
- Eliminates time and intra-period noise completely
- Support and resistance levels are crystal clear
- Built-in price target calculation method
- Patterns are simple and unambiguous
- Reduces emotional decision-making
Best Used For
- Identifying breakout levels
- Setting price targets
- Confirming trends identified on regular charts
- Long-term position trading
Combining with Other Analysis
P&F + Regular Charts
- Use P&F to identify key breakout/breakdown levels
- Switch to candlestick chart for entry timing
- Use P&F price targets for take-profit levels
- Best of both worlds approach
P&F + Relative Strength
- Compare P&F charts of related instruments
- Buy the one with P&F buy signal
- Avoid the one with P&F sell signal
- Used extensively by institutional stock traders
Key Takeaways
- P&F removes time and shows pure supply/demand
- X columns = demand, O columns = supply
- Double and triple tops/bottoms are the key patterns
- Built-in price targets using horizontal and vertical counts
- Best combined with traditional charts for entry timing
Lesson Discussion