
Price Channel Trading Strategies
Price channels are one of the most visual and reliable trading tools. They define the trading range within a trend, giving you clear entry and exit zones.
What is a Price Channel?
A price channel consists of two parallel trendlines that contain price action during a trend. The upper line connects the highs, and the lower line connects the lows.
Types of Channels
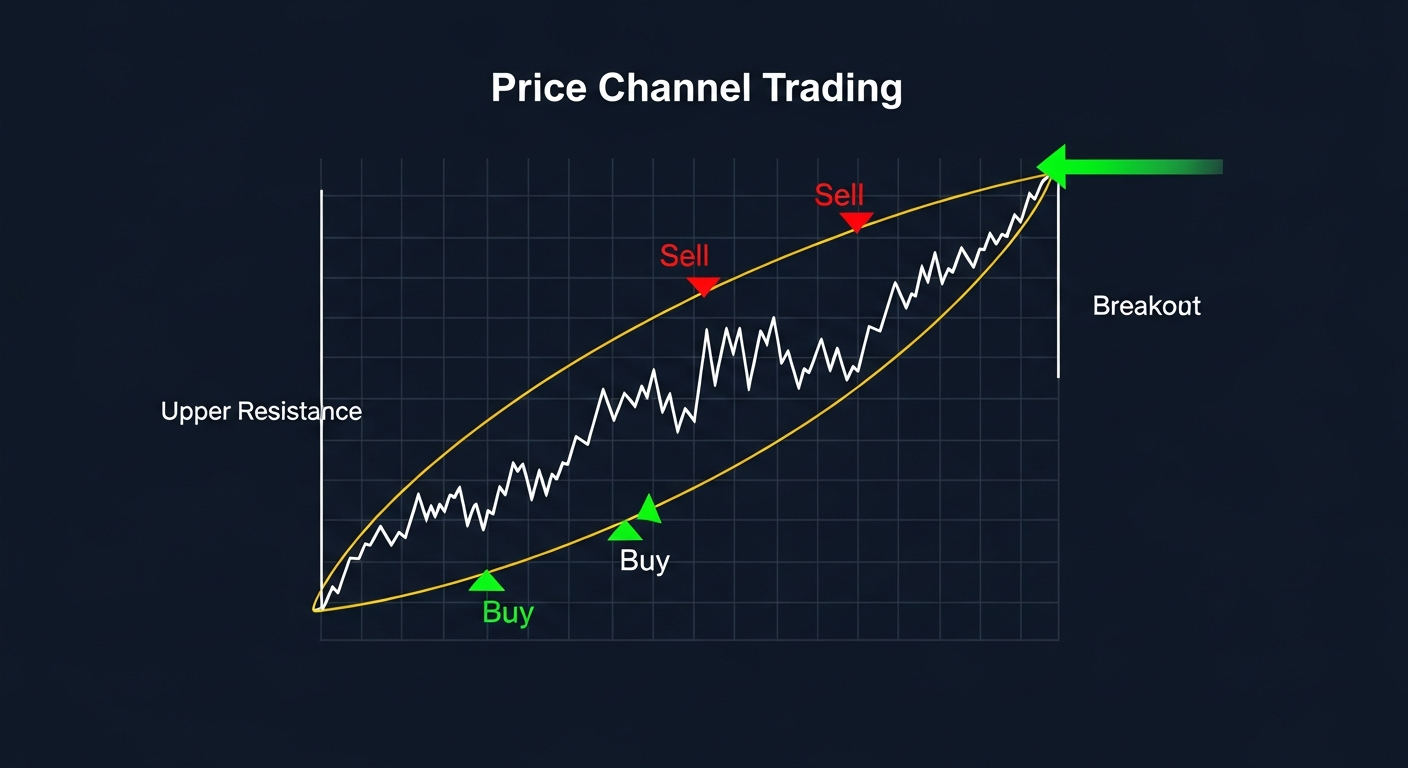
Ascending Channel
- Both lines slope upward
- Bullish trend structure
- Buy at the lower trendline (support)
- Sell or take profit at the upper trendline (resistance)
Descending Channel
- Both lines slope downward
- Bearish trend structure
- Sell at the upper trendline (resistance)
- Cover or take profit at the lower trendline (support)
Horizontal Channel (Range)
- Both lines are flat/horizontal
- Sideways market structure
- Buy at the bottom, sell at the top
- Wait for breakout for trend trades
Drawing Channels Correctly
Rules for Valid Channels
- Connect at least 3 points on one trendline
- The parallel line should touch at least 2 points
- Price should respect both boundaries
- The more touches, the stronger the channel
- Lines must be truly parallel
Anchor Points
- Use candle bodies or wicks consistently
- Using wicks catches more extreme levels
- Using bodies is more conservative
- Choose one method and stick with it
Trading Inside the Channel
Buy at Channel Bottom (Ascending Channel)
- Wait for price to touch or approach the lower trendline
- Look for a bullish reversal candle (hammer, engulfing)
- Enter long with stop below the trendline
- Target the upper trendline (or the median line)
- Risk-to-reward should be at least 1:2
Sell at Channel Top
- Wait for price to touch or approach the upper trendline
- Look for a bearish reversal candle
- Enter short with stop above the trendline
- Target the lower trendline
The Median Line
- Draw a line exactly between the two trendlines
- Acts as intermediate support/resistance
- Can be used as a halfway take-profit target
- Strong trends push price from median to the upper boundary
Channel Breakouts
Bullish Breakout (from Ascending Channel)
- Price breaks above the upper trendline
- Volume increases significantly
- Measure the channel width and project upward for target
- The old upper trendline becomes new support
Bearish Breakdown
- Price breaks below the lower trendline
- Volume confirms the breakdown
- Channel width projected downward for target
- Old lower trendline becomes new resistance
False Breakout Prevention
- Wait for a full candle close outside the channel
- Require volume confirmation
- Look for a retest of the broken boundary
- Combine with RSI or MACD divergence
Channel Width Analysis
Widening Channel
- Increasing volatility
- Trend may be losing structure
- Less reliable for trading
Narrowing Channel
- Decreasing volatility
- Potential breakout coming
- Similar to a wedge formation
Key Takeaways
- Channels define tradable boundaries within a trend
- Buy at channel support, sell at channel resistance
- The more touches a trendline has, the stronger the channel
- Channel breakouts produce measured moves equal to the channel width
- Always confirm breakouts with volume and candlestick patterns
Lesson Discussion