
Stochastic Oscillator Trading
The Stochastic Oscillator measures momentum by comparing closing price to price range over a period, identifying overbought and oversold conditions.
How It Works
Components
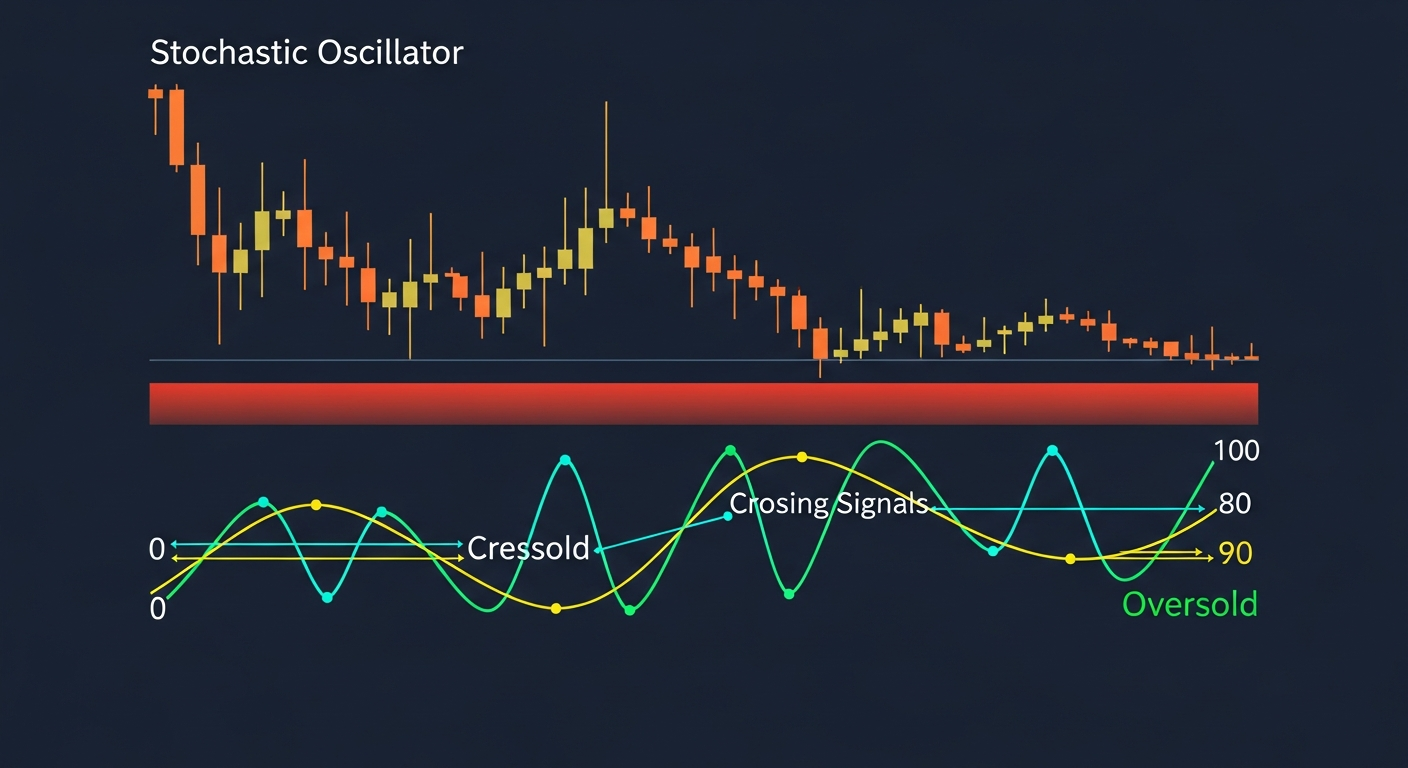
- %K Line (fast line): Main stochastic line
- %D Line (slow line): Signal line (3-period SMA of %K)
- Range: 0 to 100
- Standard settings: 14, 3, 3
Calculation Concept
- Measures where price closed relative to its range
- High value = closed near the high of range
- Low value = closed near the low of range
Key Levels
Overbought Zone (Above 80)
- Price has been strong recently
- Potential selling opportunity
- Wait for cross DOWN below 80 to sell
- In strong trends, can stay overbought long
Oversold Zone (Below 20)
- Price has been weak recently
- Potential buying opportunity
- Wait for cross UP above 20 to buy
- In strong downtrends, can stay oversold long
Trading Strategies
Crossover Strategy
- Wait for stochastic to enter overbought or oversold
- Watch for %K to cross %D
- Bullish: %K crosses above %D below 20
- Bearish: %K crosses below %D above 80
- Confirm with price action
Divergence Strategy
- Price makes new high, stochastic makes lower high
- Bearish divergence: Sell signal
- Price makes new low, stochastic makes higher low
- Bullish divergence: Buy signal
- Most powerful at extreme levels
Double Bottom/Top in Stochastic
- Stochastic makes two lows in oversold zone
- Second low higher than first
- Strong bullish signal
- Opposite for double top in overbought
Settings Variations
Fast Stochastic (5, 3)
- More sensitive
- More signals but more noise
- Good for scalping
Slow Stochastic (14, 3)
- Standard setting
- Balanced signals
- Good for swing trading
Full Stochastic (14, 3, 3)
- Most smoothed
- Fewer but cleaner signals
- Good for longer timeframes
Common Mistakes
- Selling just because stochastic is overbought in uptrend
- Buying just because stochastic is oversold in downtrend
- Ignoring the overall trend direction
- Using on very short timeframes without confirmation
- Not waiting for complete signal (cross + confirmation)
Key Takeaways
- Always consider the trend first
- Crossovers at extreme zones are most reliable
- Divergence signals are the strongest
- Combine with support and resistance
- Works best in ranging markets
Lesson Discussion