
Technical Indicators for Stocks
Technical indicators help identify trends, momentum, and potential reversals.
Trend Indicators
Moving Averages
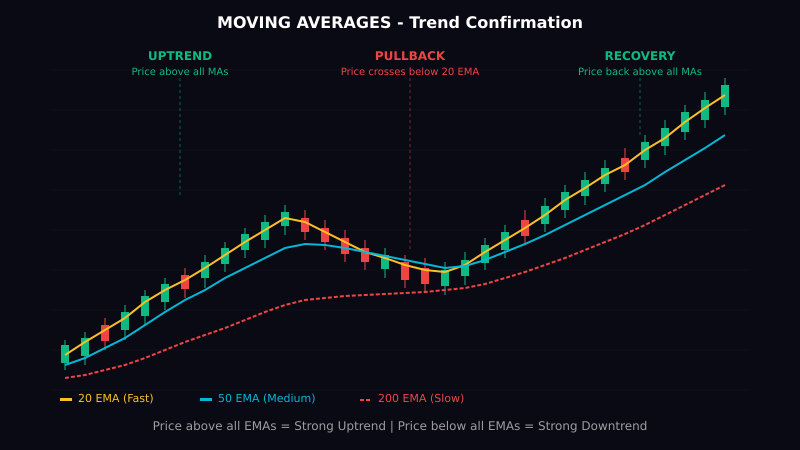
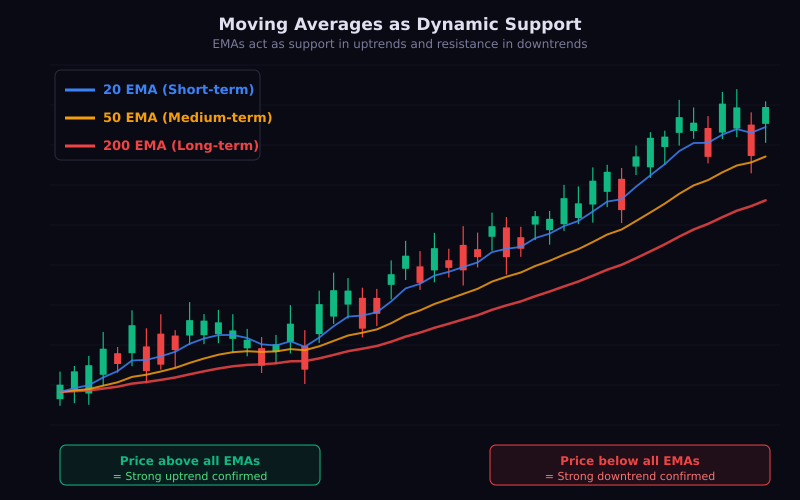
- 50-day SMA: Medium-term trend
- 200-day SMA: Long-term trend
- Price above both = bullish
- Golden Cross: 50 crosses above 200
- Death Cross: 50 crosses below 200
MACD
- Moving Average Convergence Divergence
- Two lines: MACD line and Signal line
- Histogram shows momentum strength
- Crossovers signal trend changes
- Divergence warns of reversals
Momentum Indicators
RSI (Relative Strength Index)

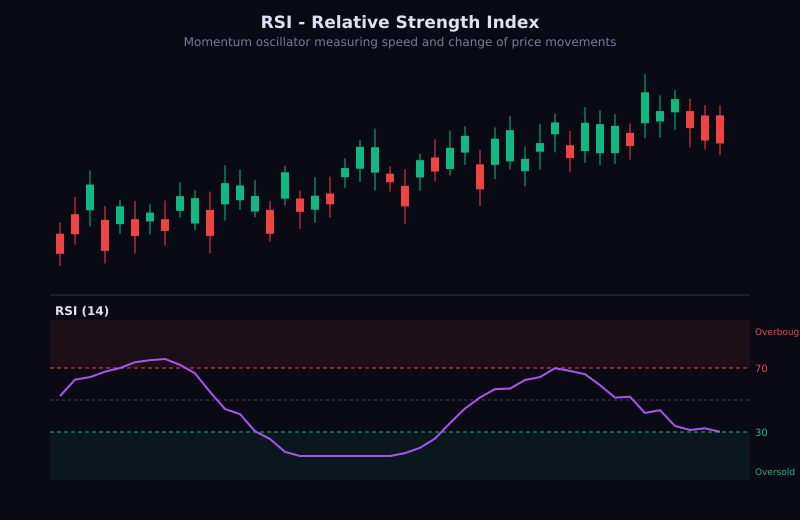
- Range: 0-100
- Above 70: Overbought
- Below 30: Oversold
- Divergence is key signal
- Best in ranging markets
Stochastic Oscillator
- Measures close relative to range
- Above 80: Overbought
- Below 20: Oversold
- Fast and slow variants
- Good for timing entries
Volume Indicators
On-Balance Volume (OBV)
- Cumulative volume measure
- Rising OBV confirms uptrend
- Divergence warns of weakness
- Simple but effective
Volume Profile
- Shows trading volume at each price
- High-volume nodes = support/resistance
- Point of Control (POC)
- Value Area (68% of volume)
Volatility Indicators
Bollinger Bands
- 20-period SMA with 2 standard deviations
- Squeeze = low volatility, breakout coming
- Touch outer band = potential reversal
- Walk the band = strong trend
ATR (Average True Range)
- Measures volatility in points
- Use for stop loss placement
- Higher ATR = wider stops needed
- Position size adjustment
Best Practices
- Use 2-3 indicators maximum
- Combine trend + momentum
- Confirm with volume
- No indicator is perfect
- Price action is the ultimate indicator
Lesson Discussion