
Wedge Patterns Trading
Wedge patterns are powerful reversal and continuation signals used by institutional traders worldwide.
What is a Wedge Pattern?
Definition
- Converging trendlines with both sloping same direction
- Price compresses into a narrowing range
- Volume typically decreases during formation
- Breakout direction signals the trade
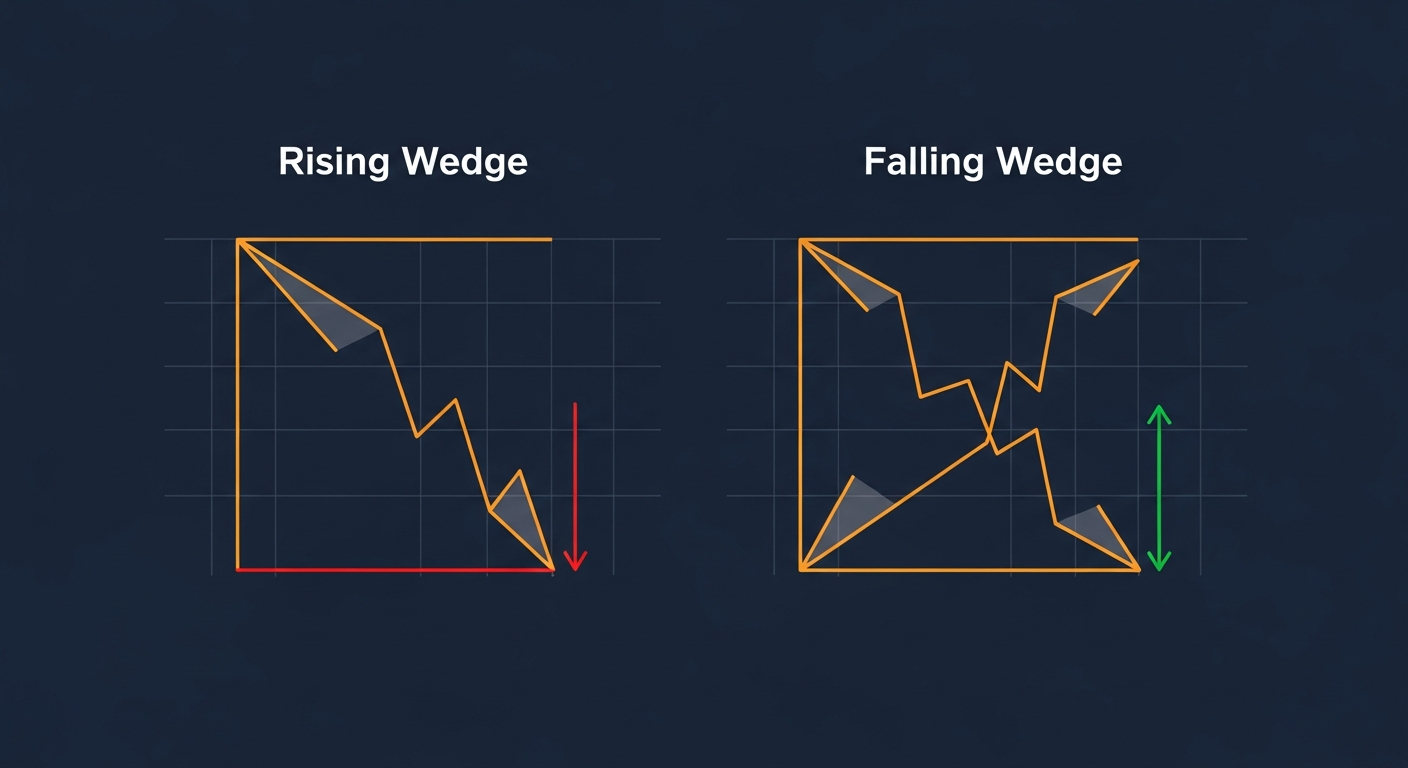
Rising Wedge (Bearish)
Formation
- Both trendlines slope upward
- Upper trendline slopes less steeply
- Price makes higher highs and higher lows
- But range narrows over time
Trading Rules
- Wait for break below lower trendline
- Volume spike confirms breakout
- Target: Height of wedge at widest point
- Stop loss: Above last swing high inside wedge
Where It Appears
- After an uptrend (reversal signal)
- During a downtrend (continuation pattern)
- Near resistance levels
Falling Wedge (Bullish)
Formation
- Both trendlines slope downward
- Lower trendline slopes more steeply
- Price makes lower highs and lower lows
- Range narrows as pattern develops
Trading Rules
- Wait for break above upper trendline
- Volume confirmation essential
- Target: Height of wedge projected from breakout
- Stop loss: Below last swing low inside wedge
Where It Appears
- After a downtrend (reversal signal)
- During an uptrend (continuation pattern)
- Near support levels
Key Differences from Triangles
- Triangles have one flat trendline
- Wedges have both lines sloping same direction
- Wedges typically take longer to form
- Wedge breakouts tend to be more explosive
Common Mistakes
- Entering before confirmed breakout
- Ignoring volume on breakout
- Confusing wedges with channels
- Not waiting for retest of broken trendline
- Setting stops too tight
Lesson Discussion