
Ichimoku Cloud Mastery
Ichimoku Kinko Hyo provides a complete trading system in one indicator. It shows trend direction, momentum, support, resistance, and timing signals simultaneously.
The Five Components
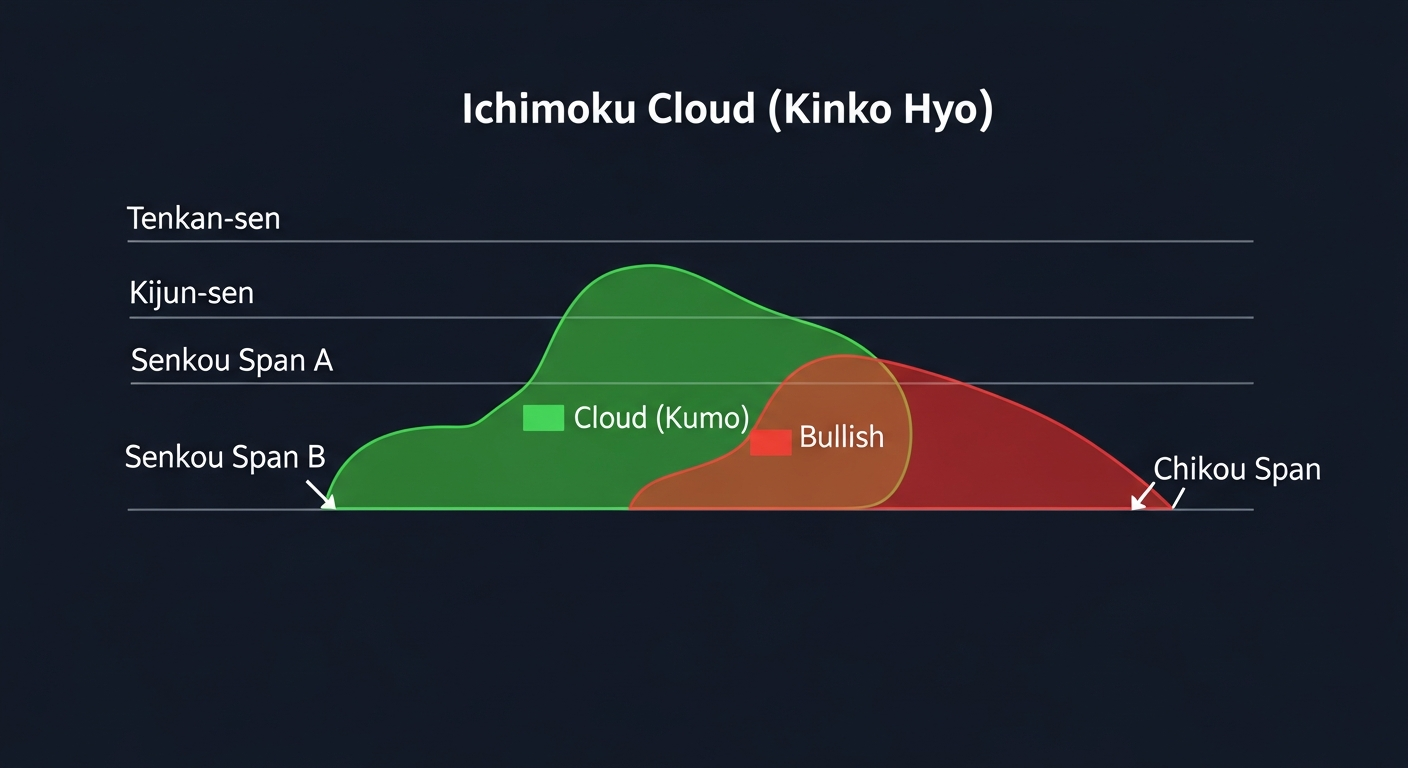
Tenkan-Sen (Conversion Line)
- Calculated as: (9-period highest high + 9-period lowest low) / 2
- Represents short-term equilibrium
- Acts like a fast moving average but uses midpoint, not close
- When price is above Tenkan: Short-term bullish
Kijun-Sen (Base Line)
- Calculated as: (26-period highest high + 26-period lowest low) / 2
- Represents medium-term equilibrium
- Stronger support/resistance than Tenkan
- Flat Kijun indicates a ranging market
Senkou Span A (Leading Span A)
- Average of Tenkan and Kijun, plotted 26 periods into the future
- Forms one boundary of the Kumo (cloud)
- Faster-moving cloud edge
Senkou Span B (Leading Span B)
- 52-period midpoint, plotted 26 periods into the future
- Forms the other boundary of the cloud
- Slower-moving cloud edge, acts as stronger S/R
Chikou Span (Lagging Span)
- Current closing price plotted 26 periods into the past
- When Chikou is above past price action: Bullish confirmation
- Often overlooked but very important for confirming signals
Reading the Cloud (Kumo)
Bullish Cloud
- Senkou Span A is above Senkou Span B
- Cloud is typically colored green
- Price above a bullish cloud = strong uptrend
Bearish Cloud
- Senkou Span B is above Senkou Span A
- Cloud is typically colored red
- Price below a bearish cloud = strong downtrend
Cloud Thickness
- Thick cloud = strong support/resistance (harder to break through)
- Thin cloud = weak support/resistance (easy to break)
- Cloud twist (Span A and Span B cross) = potential trend change
Trading Signals
TK Cross (Tenkan/Kijun Crossover)
- Tenkan crosses above Kijun = Bullish signal
- Tenkan crosses below Kijun = Bearish signal
- Signal strength depends on location relative to cloud
- Above cloud = strong buy
- Inside cloud = neutral
- Below cloud = weak buy (consider waiting)
Kumo Breakout
- Price breaking above the cloud = Strong buy signal
- Price breaking below the cloud = Strong sell signal
- The breakout is strongest when volume confirms
- A thick cloud breakout is more significant than a thin cloud breakout
Kumo Twist
- When Senkou Span A crosses Senkou Span B
- Indicates a potential trend change 26 periods in the future
- Use as an early warning, not a direct entry signal
Chikou Span Confirmation
- Chikou above past price and cloud = Full bullish confirmation
- Chikou below past price and cloud = Full bearish confirmation
- If Chikou is blocked by past price/cloud, the signal is weaker
The Five-Line Confirmation
The strongest signals occur when all five elements align:
- Price above the cloud
- Cloud is bullish (Span A above Span B)
- Tenkan above Kijun (TK cross bullish)
- Chikou above past price
- Future cloud is bullish and expanding
Timeframe Considerations
- Weekly: Best for identifying major trends
- Daily: Standard trading timeframe, most reliable signals
- 4H: Good for swing trading entries
- Intraday (1H and below): More noise, combine with other tools
Key Takeaways
- Ichimoku provides a complete trading system on its own
- Cloud thickness indicates support/resistance strength
- TK cross location matters: above cloud is strongest
- Five-line alignment gives the highest probability trades
- Chikou Span is the most underrated confirmation tool
Lesson Discussion