
Moving Averages Deep Dive
Moving averages are the foundation of trend analysis. Master them for consistent trading.
Types of Moving Averages
Simple Moving Average (SMA)
- Adds closing prices, divides by periods
- Equal weight to all prices
- Smoother, slower to react
- Good for longer-term trends
Exponential Moving Average (EMA)
- More weight to recent prices
- Faster response to price changes
- Better for shorter timeframes
- More popular among active traders
Popular MA Settings
Short-Term
- 8, 9, 10 EMA - Very fast, scalping
- 20, 21 EMA - Short-term trend
Medium-Term
- 50 SMA/EMA - Key dynamic support/resistance
- 89 EMA - Fibonacci-based, less common
Long-Term
- 100 SMA - Medium institutional level
- 200 SMA - Major trend indicator, institutional
Trading Strategies
MA Crossover Strategy
- Fast MA crosses slow MA
- Golden Cross: 50 crosses above 200 (bullish)
- Death Cross: 50 crosses below 200 (bearish)
- Use for trend confirmation, not entries
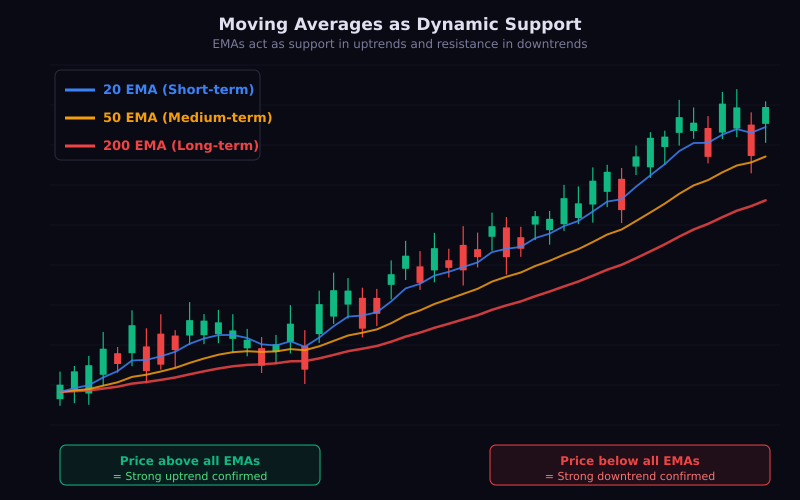
Dynamic Support/Resistance
- Price often bounces off key MAs
- In uptrend: Buy at 20/50 EMA
- In downtrend: Sell at 20/50 EMA
- Wait for rejection candle
MA Ribbon Strategy
- Multiple MAs (8, 13, 21, 34, 55 EMA)
- Expanding ribbon = strong trend
- Contracting ribbon = weakening trend
- Trade in ribbon direction
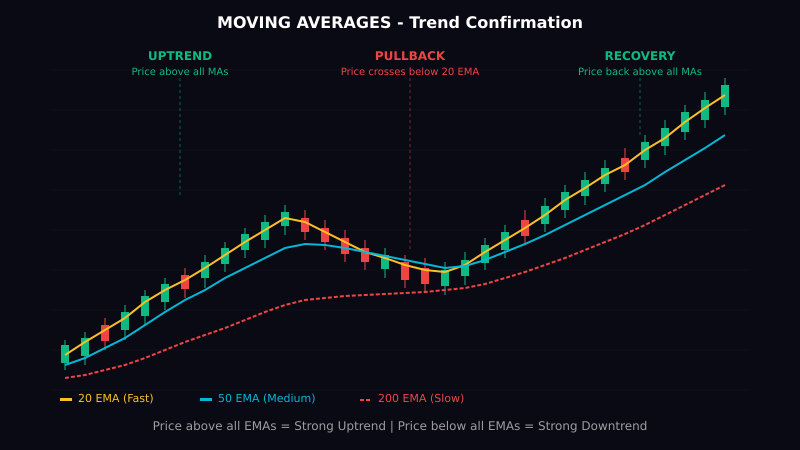
Reading the Market with MAs
Strong Trend Signs
- Price stays on one side of MA
- MAs are properly stacked (fast above slow)
- Pullbacks find support at MA
Weak Trend/Ranging
- Price crosses MA frequently
- MAs are flat or crossing
- No clear direction
Common Mistakes
- Too many MAs cluttering charts
- Using MAs in ranging markets
- Not waiting for confirmation
- Ignoring higher timeframe MA position
- Chasing after MA crossover
Lesson Discussion