
RSI and Oscillator Trading
Oscillators help identify overbought/oversold conditions and potential reversals.
Understanding RSI

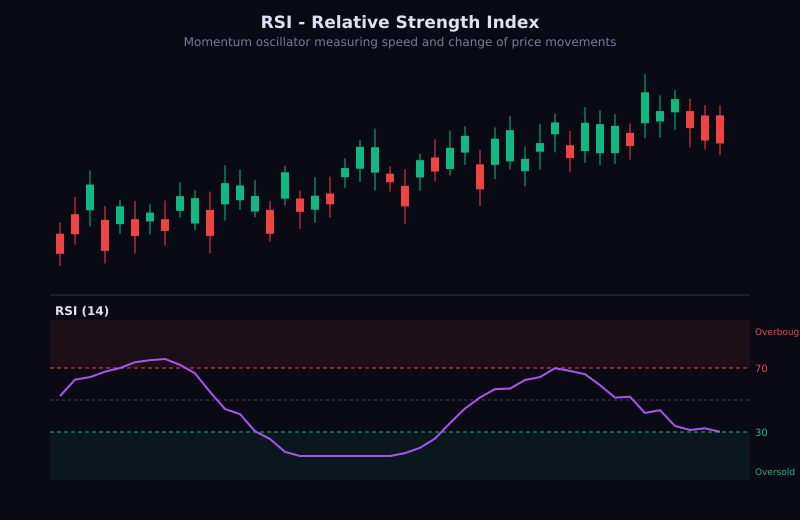
What is RSI?
- Relative Strength Index
- Momentum oscillator (0-100)
- Default setting: 14 periods
- Created by J. Welles Wilder
RSI Levels
- Above 70: Overbought
- Below 30: Oversold
- 50 level: Momentum centerline
RSI Trading Methods
Overbought/Oversold
- RSI above 70 = look for shorts
- RSI below 30 = look for longs
- Wait for confirmation, do not trade blindly
- Works best in ranging markets
RSI Divergence
- Price makes higher high, RSI makes lower high = bearish
- Price makes lower low, RSI makes higher low = bullish
- Powerful reversal signal
- Combine with key levels
RSI Centerline Cross
- Cross above 50 = bullish momentum
- Cross below 50 = bearish momentum
- Good for trend confirmation
- Less common strategy
Other Popular Oscillators
Stochastic Oscillator
- Measures close relative to range
- %K and %D lines
- Above 80: Overbought
- Below 20: Oversold
- Crossovers as signals
MACD
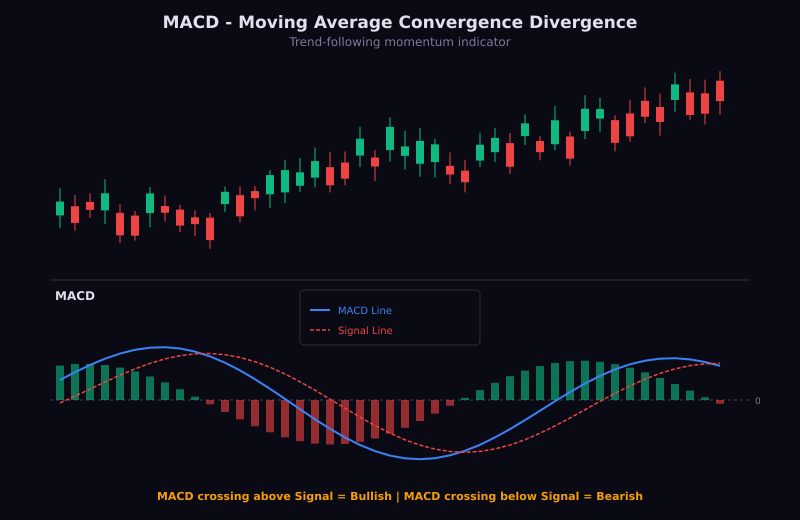

- Moving Average Convergence Divergence
- MACD line and Signal line
- Histogram shows momentum
- Crossovers and divergences
CCI (Commodity Channel Index)
- Measures price vs average
- Above 100: Strong up
- Below -100: Strong down
- Good for breakout confirmation
Best Practices
When Oscillators Work Best
- Ranging markets
- Finding reversals at key levels
- Confirming trend exhaustion
- Identifying divergences
When Oscillators Fail
- Strong trending markets
- RSI can stay overbought for weeks
- Never trade overbought/oversold alone
- Trending markets override oscillators
Lesson Discussion